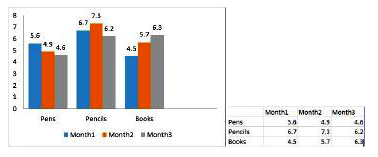
The following chart shows the sales (in thousands) of pens , pencils and books in months1, months2 and months3. Answer the question based on the chart .
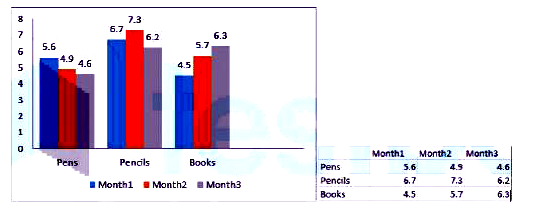
Which month has the highest sales ?
Month1 and Month 3
Month 1
Month 3
Month 2
The correct Answer is:D
Step by step video, text & image solution for The following chart shows the sales (in thousands) of pens , pencils and books in months1, months2 and months3. Answer the question based on the chart . Which month has the highest sales ? by Maths experts to help you in doubts & scoring excellent marks in Class 14 exams.
Updated on:21/07/2023Similar Questions
The following graph shows the sales of cars (in thousands) in four cities in 4 years. Study the graph and answer the question.
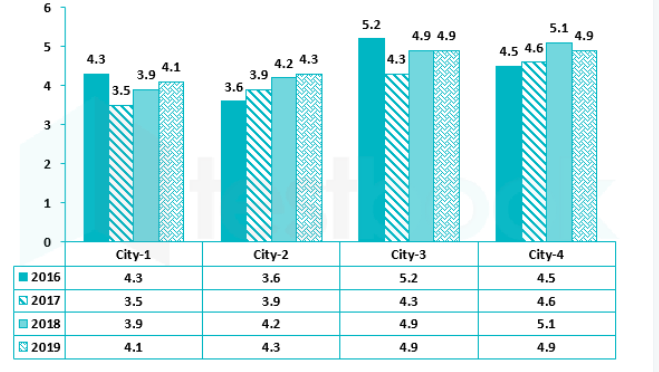
Which city has the highest sales?
View SolutionThe following graph shows the sales of cars (in thousands) in four cities in 4 years. Study the graph and answer the question
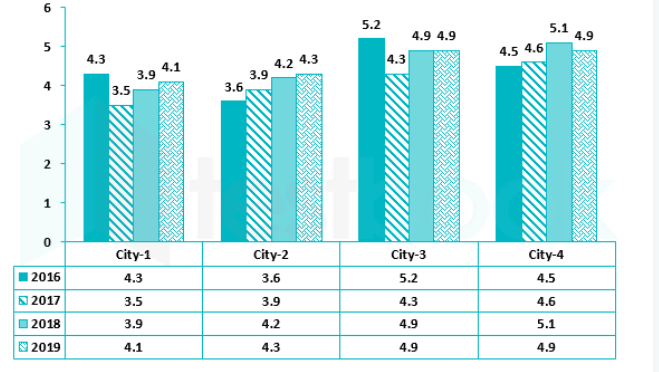
In which year. the sales are highest?
View Solution
Knowledge Check
The following chart shows the sales ( in thousands ) of pens , pencils and books in month 1, month2 and months 3 . Answer the question based on the chart .
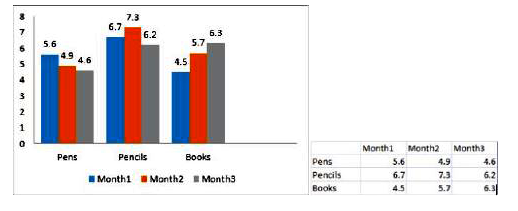
Which product has the highest percentage of sales, and in which month (among all months) ?APens, Month 1BPencils , Month 2CPencils , Months 3DBooks , Months 3The following chart shows the sales (in thousands) of pencils and books in month1, month2, and month3, Answer the question based on the chart .
Which product has the highest sales in all 3 months ?APens and BooksBBooksCPensDPencilsThe following charts shows the sales (in thousands) of pens , pencils and books in month1 , month2 and month3 . Answer the question based on the chart .
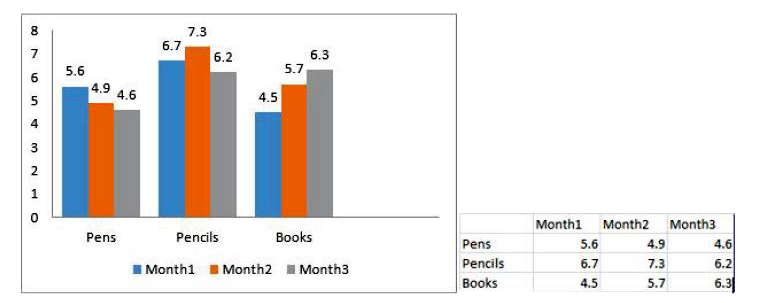
What is the average number of pens sold in the 3 months ?A3987B4935C5033D5432

During which month did the company have he highest sales ?
View SolutionThe following Bar chart shows the sales of a company XYZ (in Rs Crore). Study the chart and answer the following questions.
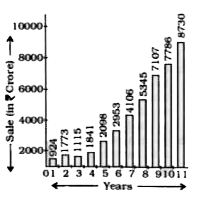
The 2nd highest sale in the year :
View SolutionThe following Bar chart shows the sales of a company XYZ (in Rs Crore). Study the chart and answer the following questions.
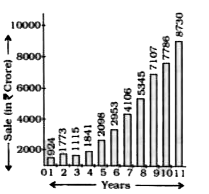
The 2nd least sale is in the year :
View SolutionThe following Bar chart shows the sales of a company XYZ (in Rs Crore). Study the chart and answer the following questions.
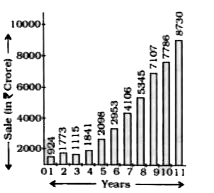
The sale in the year 4 is less than the sale in the year 8, by
View SolutionThe given bar chart shows the sales of books in four metro branches of a company for the years 2014 and 2015.
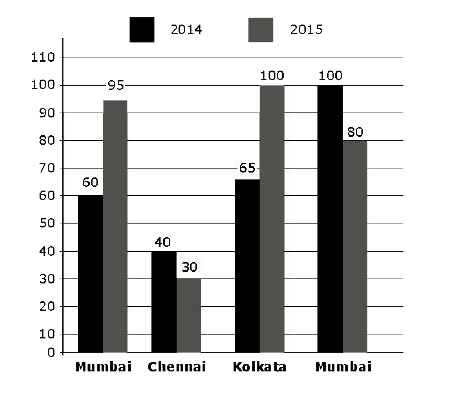
In the given bar chart, which branch has the highest increase in sale in 2015 as compared to 2014?
View Solution
