The following graph shows the data of the number of candidates that appeared and qualified for a competitve exam from the colleges A , B,C,D,E .
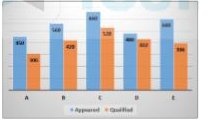
Based on the information , the difference between the percentage of students that qualified , from the colleges B and D is :
20
15
12
18
The correct Answer is:B
Step by step video, text & image solution for The following graph shows the data of the number of candidates that appeared and qualified for a competitve exam from the colleges A , B,C,D,E . Based on the information , the difference between the percentage of students that qualified , from the colleges B and D is : by Maths experts to help you in doubts & scoring excellent marks in Class 14 exams.
Similar Questions
The following graph shows the data of the number of candidates that appeared and qualified for a competitive exam from the colleges A, B, C, D, E.
निम्नलिखित आरेख उन उम्मीदवारों की संख्या को दिखाता है जो कॉलेजों A, B, C, D, E से प्रतियोगी परीक्षा के लिए उपस्थित हुए और सफल हुए|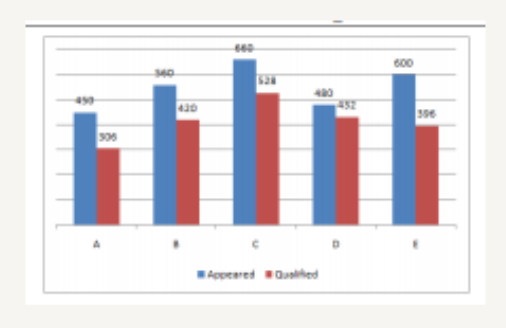 Based on the information, the difference between the percentage of students that qualified, from
the colleges B and D is:
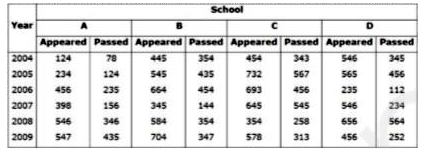
जानकारी के आधार पर, कॉलेजों B और D से सफल हुए छात्रों के प्रतिशत के बीच का अंतर है:View SolutionIn which year was the difference between the number of candidates who appeared and passed in the exam from school - B second lowest?
 View Solution
Knowledge Check
- Question 1 - Select One
The following table represents the number of candidates that appeared and qualified in a competitive examination from different states over five years. Study the table and answer the questions that follow.
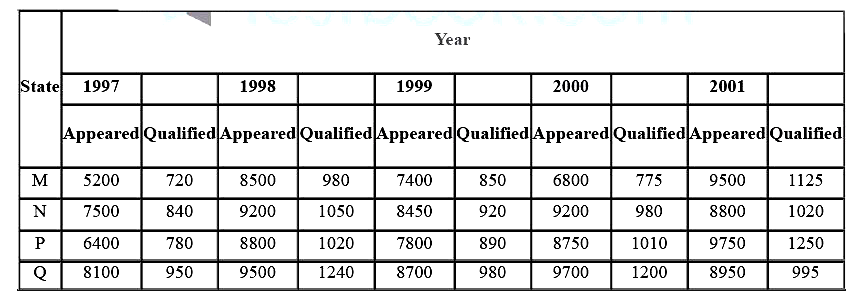
The total number of candidates that qualified from all the states together in 1998 is approximately what percentage of the total number of candidates that qualified from all the states together in 2001? (Correct to Two decimal points)Aa. 90.72%Bb. 97.72%Cc. 96.70%Dd. 94.7% - Question 2 - Select One
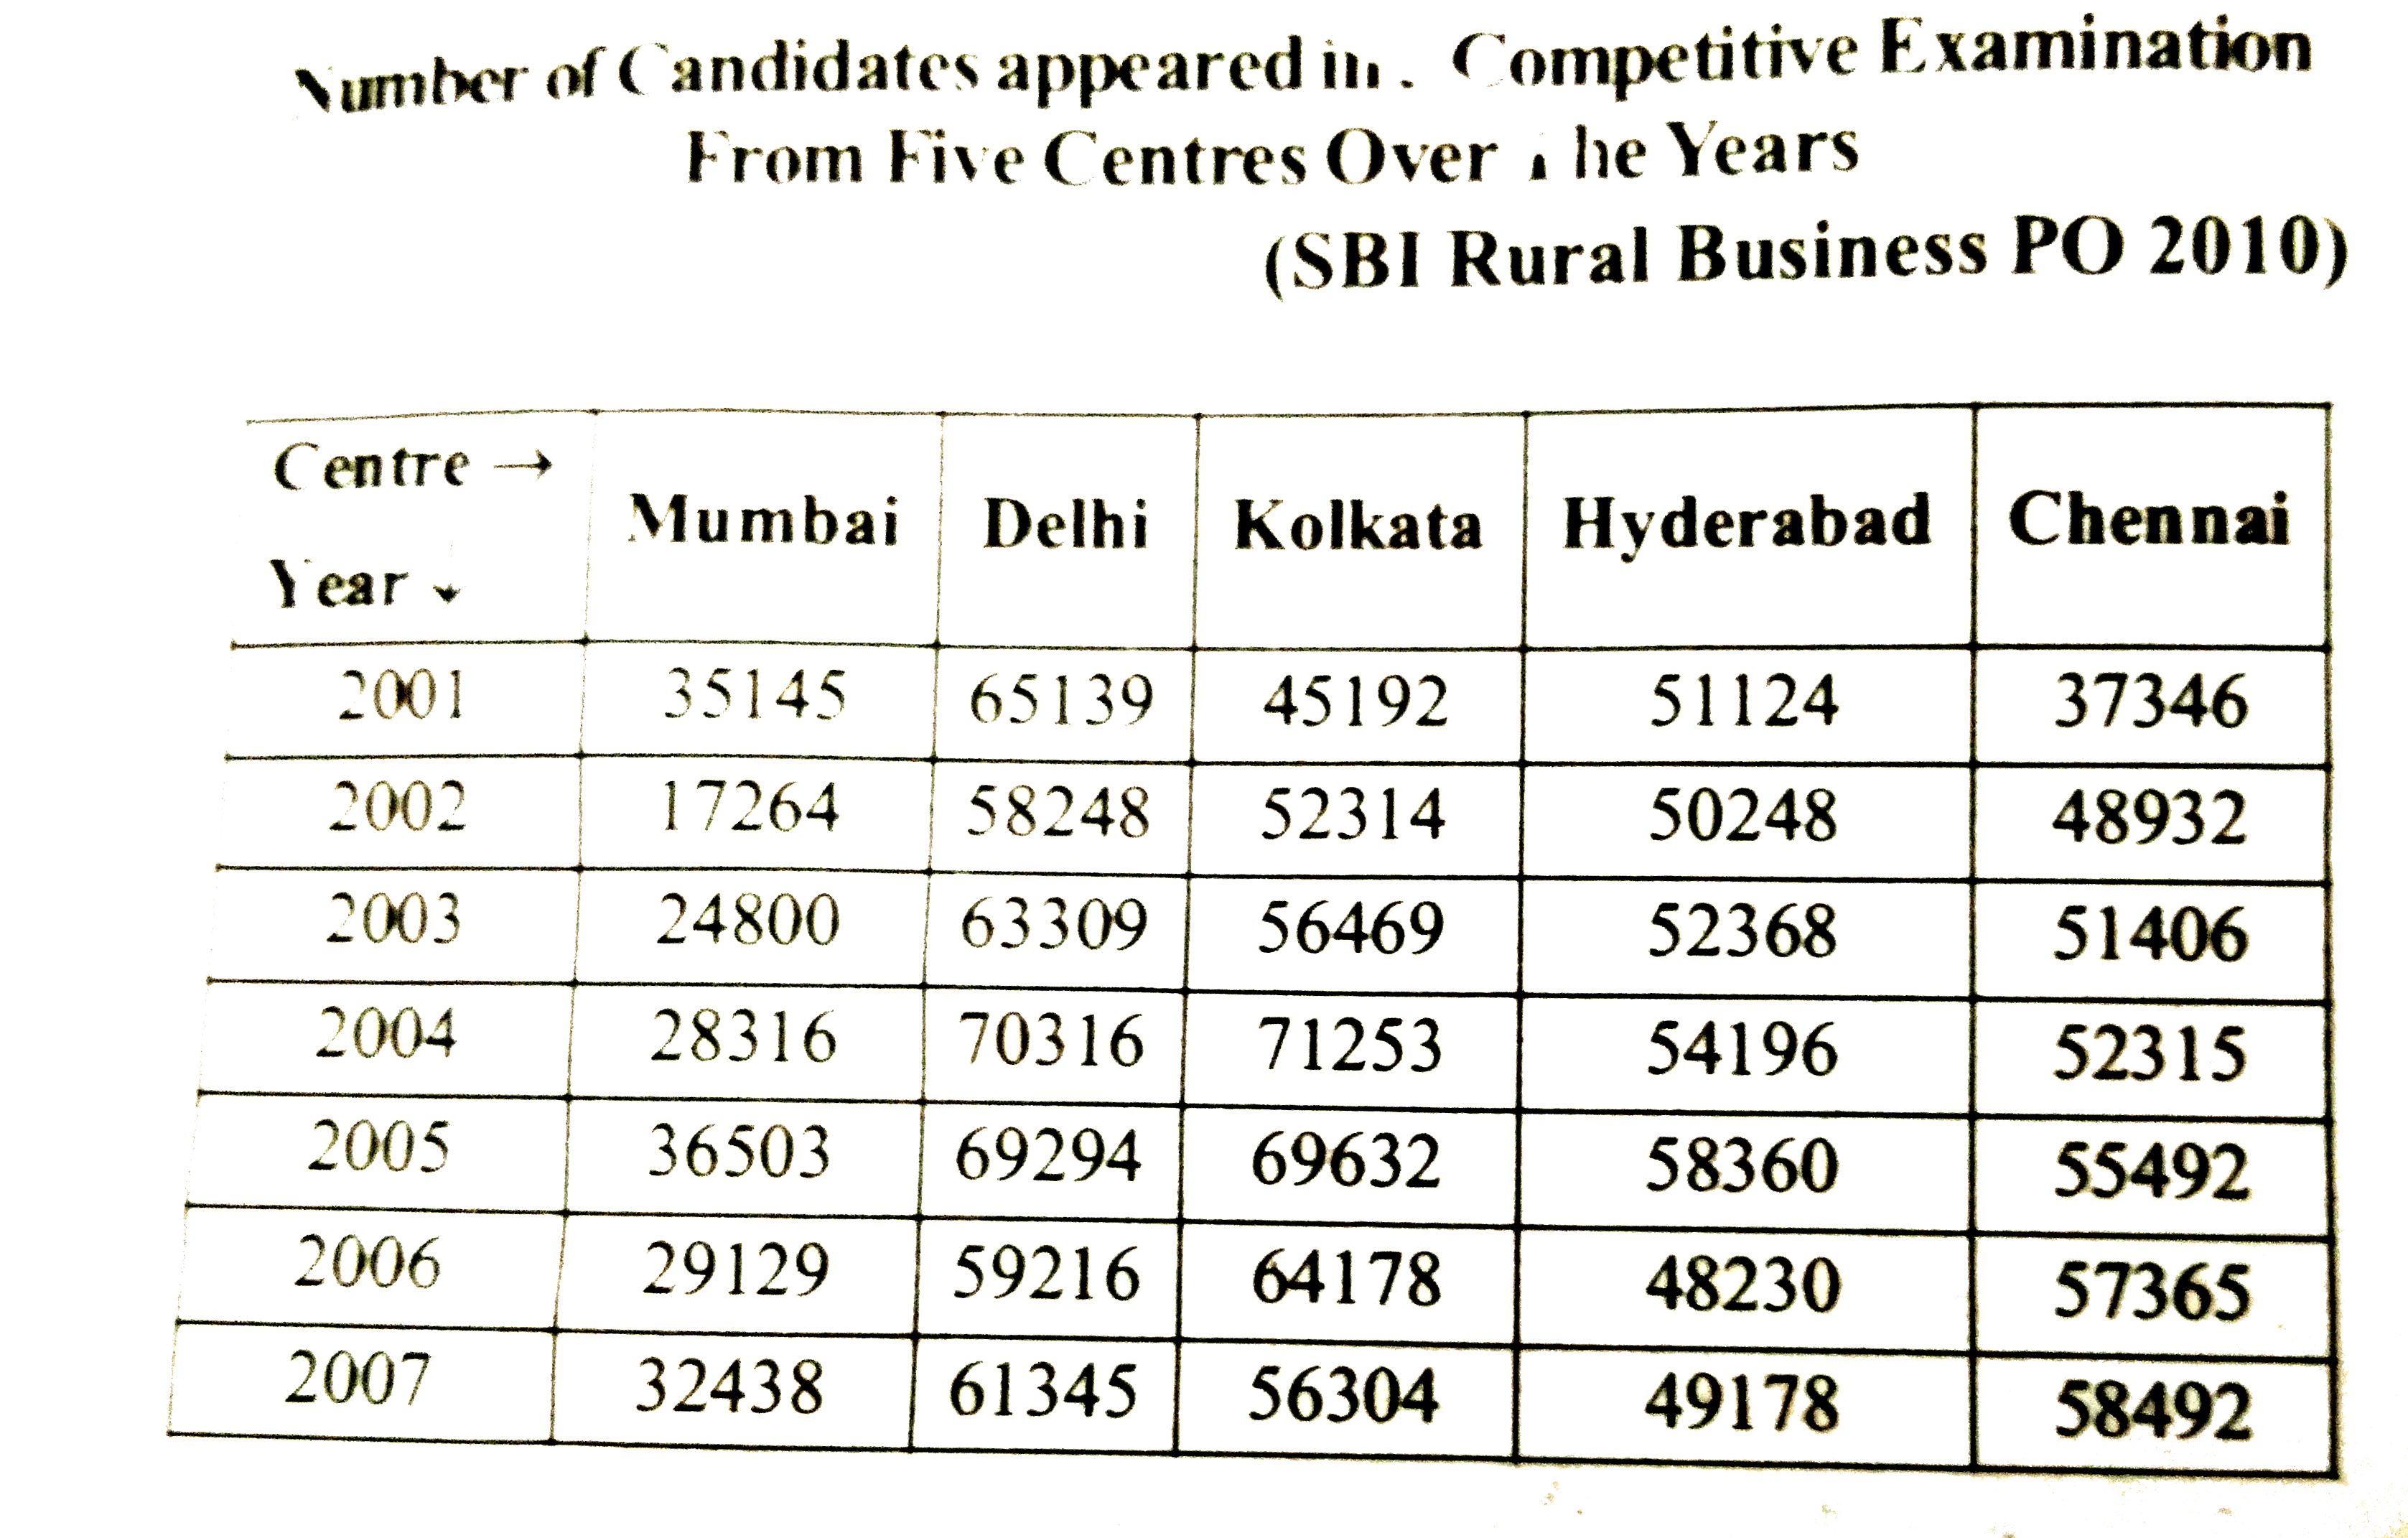
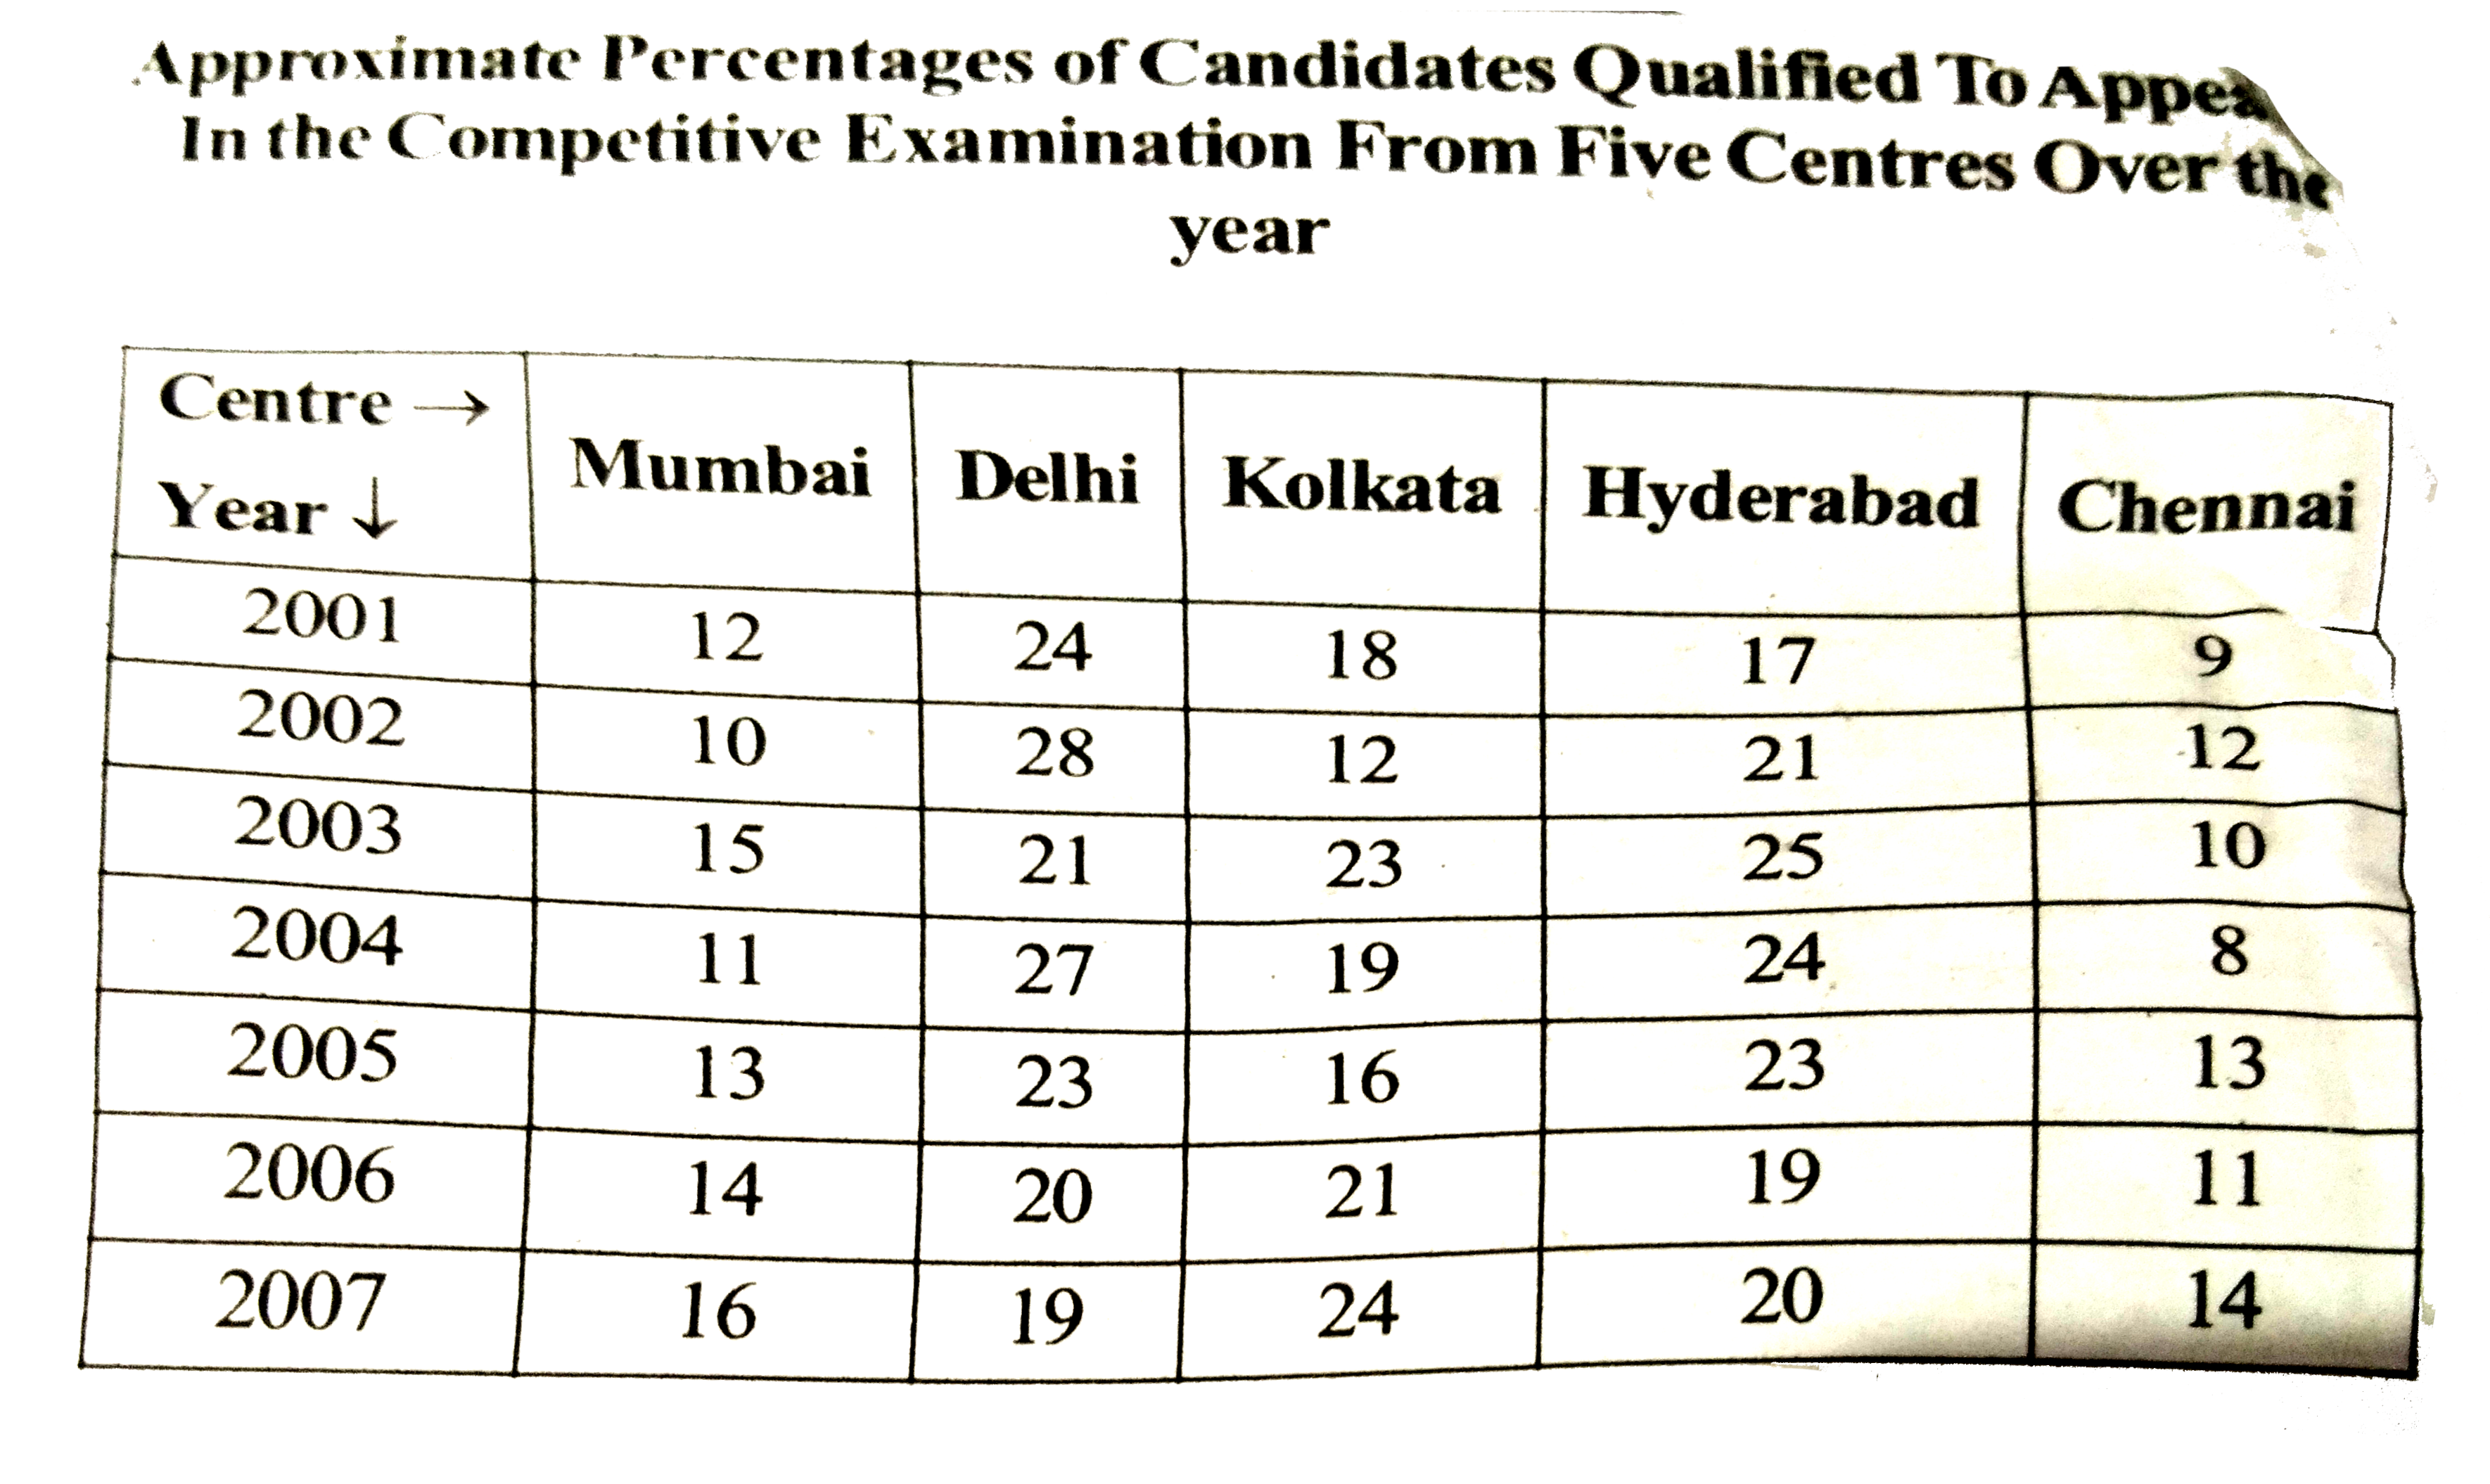
Approximately how many candidates appearing from Kolkata in 2004 qualified int eh competitive examination ?
Approximately what was the difference the number of candidates qualified from Hyderabad in 2001 and 2002 ?A1680B1440C1450D2060 - Question 3 - Select One
Study the given table carefully and answer the questions given below-
The given table represents the number of candidates appeared and qualified during 2001 to 2006 form 6 states.

what is the difference between percentage of qualified students of state Q in 2001 to the percentage of qualified students in 2002 ?A1B2.25C1.63D2.5
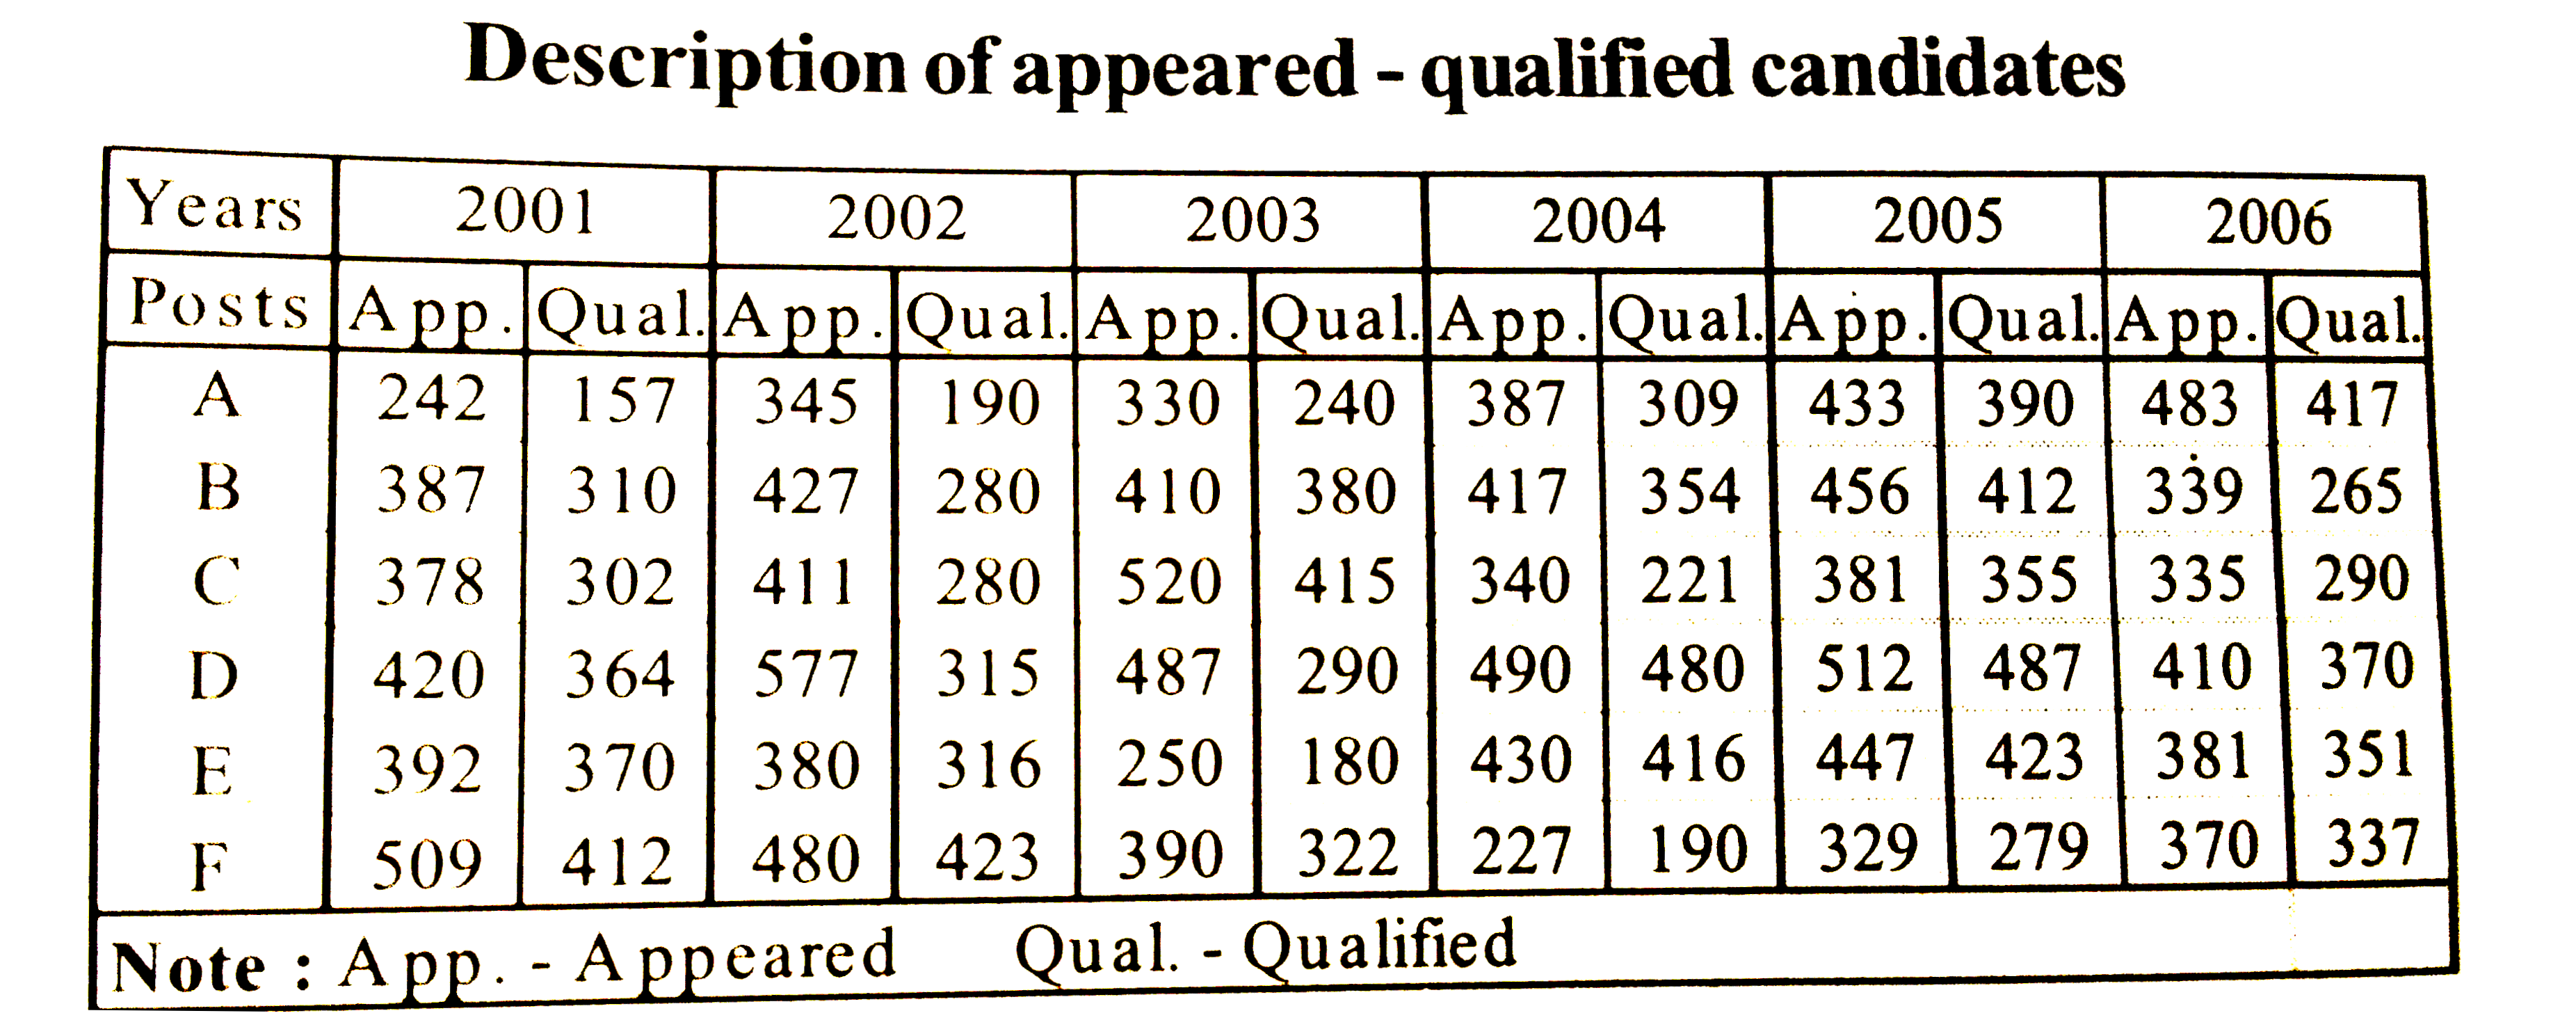
The difference between the number of candidates who appeared and qualified for the post D in the years 2001,2002 and 2003 isView SolutionStudy the following graph and answer the questions given below it.
Number of Students from Various Faculties Studying in Various Colleges (Number in Thousands)
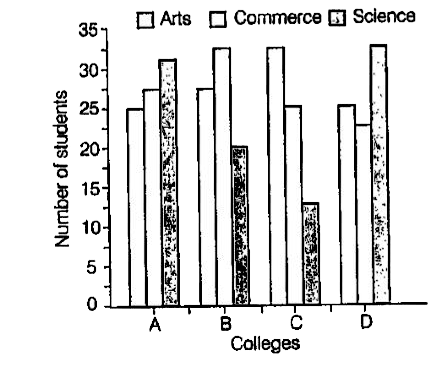
What is the difference between the total number of students from the faculty of Commerce from all the colleges together and the total number of students from the faculty of Science from all the colleges together?View SolutionStudy the following graph carefully and answer the question given below
Number of candidates appeared (in thousand) and percentage of candidates qualified in a competitive examination over the years.
No. of candidates appeared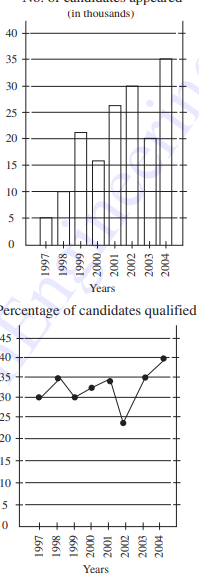
What was the percentage drop in thee number of candidates appeared from the year 2002 to 2003?View SolutionThe given pie chart shows the percentage of students enerolled into the colleges A,B,C,D,E and F in a city , and the table shows the ratio of boys to girls in the college .
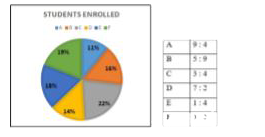
Based on this information , if the total number of students is 9800, then the number of girls in the college B is :View SolutionStudy the following graph carefully and answer the question given below
Number of candidates appeared (in thousand) and percentage of candidates qualified in a competitive examination over the years.
No. of candidates appeared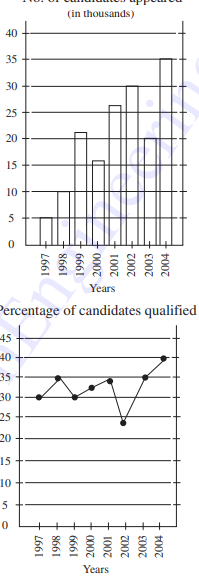
What was the ratio between the number of candidates appeared in 1997 and the number of candidates qualified in 2004?View Solution
