The average of sales of a furniture shop in the years 2015, 2016, 2017, 2018 is Rs 16300, and that for years 2016, 2017, 2018, 2019 is Rs 18450. If the sales in 2019 are Rs 9200, then what are the sales in 2015?
Rs 768
Rs 560
Rs 600
Rs 865
The correct Answer is:C
To solve the problem step by step, we need to find the sales in 2015 based on the given averages and the sales figure for 2019.
Step 1: Calculate the total sales for the years 2015, 2016, 2017, and 2018.
The average sales for these four years is given as Rs 16,300.
Using the formula for average:
Average=Sum of observationsNumber of observations
We can rearrange this to find the sum of observations:
Sum of observations=Average×Number of observations
For the years 2015 to 2018:
Sum2015−2018=16300×4=65200
Step 2: Calculate the total sales for the years 2016, 2017, 2018, and 2019.
The average sales for these four years is given as Rs 18,450.
Using the same formula:
Sum2016−2019=18450×4=73800
Step 3: Use the sales figure for 2019 to find the total sales for 2016, 2017, and 2018.
We know the sales in 2019 is Rs 9,200. Therefore, we can find the total sales for the years 2016, 2017, and 2018:
Sum2016−2018=Sum2016−2019−Sales in 2019
Sum2016−2018=73800−9200=64600
Step 4: Find the sales in 2015.
Now, we can find the sales in 2015 by subtracting the total sales for the years 2016, 2017, and 2018 from the total sales for the years 2015, 2016, 2017, and 2018:
Sales in 2015=Sum2015−2018−Sum2016−2018
Sales in 2015=65200−64600=600
Final Answer:
The sales in 2015 are Rs 600.
---
The average sales for these four years is given as Rs 16,300.
Average=Sum of observationsNumber of observations
We can rearrange this to find the sum of observations:
Sum of observations=Average×Number of observations
For the years 2015 to 2018:
Sum2015−2018=16300×4=65200
The average sales for these four years is given as Rs 18,450.
Sum2016−2019=18450×4=73800
We know the sales in 2019 is Rs 9,200. Therefore, we can find the total sales for the years 2016, 2017, and 2018:
Sum2016−2018=Sum2016−2019−Sales in 2019
Sum2016−2018=73800−9200=64600
Now, we can find the sales in 2015 by subtracting the total sales for the years 2016, 2017, and 2018 from the total sales for the years 2015, 2016, 2017, and 2018:
Sales in 2015=Sum2015−2018−Sum2016−2018
Sales in 2015=65200−64600=600
The sales in 2015 are Rs 600.
Similar Questions
Study the following information carefully and answer the given questions:
In the year 2015, the salary expense of a company is 16 lakhs and the total number of employees is 80 and in the year 2016, the average salary of employees is Rs. 4000 more than the previous year. The salary expense in 2016 is 20% more than the previous year. Theother expense in the year 2016 is 34 lakhs. The total expense in the year 2015 and 2016 is same. In the year 2017, the number of employees is 5 less than the previous year. The average salary of employees in the year 2017 is Rs. 15000 and the other expense in the year 2017 is Rs. 47.75 lakhs.
Note: Salary expense = Average salary of employees * Number of employees Total expense = Salary expense + other expense
The total expense in the year 2015 is approximately what percentage of total expense in the year 2017?
View SolutionThe profit for the five years of a firm are as follows – year 2013 Rs. 4,00,000, year 2014 Rs. 3,98,000, year 2015 Rs. 4,50,000, year 2016 Rs. 4,45,000 and year 2017 Rs. 5,00,000. Calculate goodwill of the firm on the basis of 4 years purchase of 5 years average profits.
View Solution
Knowledge Check
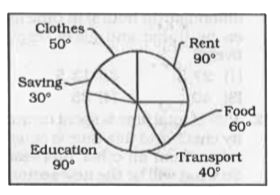
The following pie chart shows the distribution of expenses (in degrees) of a family during 2016. Total income of the family in 2016 = Rs. 1080000

Income of family in the year 2015 was 20% less than that in the year 2016 and the ratio of their savings in 2015 and 2016 is 2:5. Approximately what percentage they saved in the year 2015?A6.17B4.166C3.24D5.66The total imports of steel in 2014, 2016 and 2017 is what percent less than the total exports in 2013,2015 and 2017
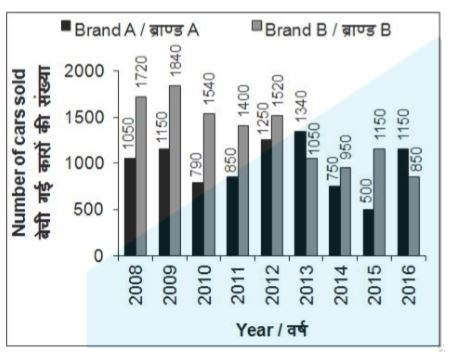
A13.4B15.8C16.2D14.5The bar chart given below shows the number of cars sold by brand A and B for the year for 2008 to 2016

The total sales of the two brands in year 2015 is what percent of the total sales in 2016?A82.5B86.5C87.5D79.5
A shop of electronic goods is closed on Monday. The average daily sales for remaining six days of a week is Rs 15,640/- and the average sale of Tuesday to Saturday is Rs 14,124/- The sales on Sunday is (a) Rs 20,188/- (b) Data inadequate (c) Rs 23,220/- (d) Rs 21,704/-
View SolutionA, B and C are partners in a firm sharing profit/loss in the ratio of 2:2:1. On March 31,2019, C died. Accounts are closed on Dec., 31 every year. The sales for the year 2018 was Rs. 6,00,000 and the profits were Rs. 60,000. The sales for the period from Jan. 1, 2019 to March 31,2019 were Rs. 2,00,000. The share of deceased partner in the current year's profits on the basis of sales is :
View SolutionAnswer the questions based on the information given below:
Three business partners invested for 5 years in a business in the years 2013, 2014, 2015, 2016 and 2017 respectively. The amounts invested by A, B and C in the year 2014 are Rs. 25000, 5000 and 15000 respectively. The profits earned by C in the year 2015 and 2016 are 16000 Rs. and 21000 Rs. respectively. The investment made by A, B and C in the year 2017 are 10000, 20000 and 30000 respectively. The total profit earned in the year 2014 is 75000 Rs. The total investment made in the year 2016 is Rs. 65000 and the ratio of amount invested by A, B and C is 5: 6: 2, respectively. The profits earned by C in the 2013 and A in 2017 are 105000 Rs. and 135000 Rs. respectively. The amount invested by B for the year 2013 is Rs. 20000 and the ratio of amount invested by A, B and C is 3: 4: 5, respectively. The profit earned by B in the year 2014 is 12500 Rs. The amount invested by B and C in the year 2015 is same and is equal to the amount invested by A in 2017. The amount invested by A in 2015 is equal to the amount invested by C in 2014. Also given that, the period of investment made by the business partners is not fixed.
Who has been appointed the first-ever Chief Financial Officer (CFO) of the Reserve Bank of India (RBI)?
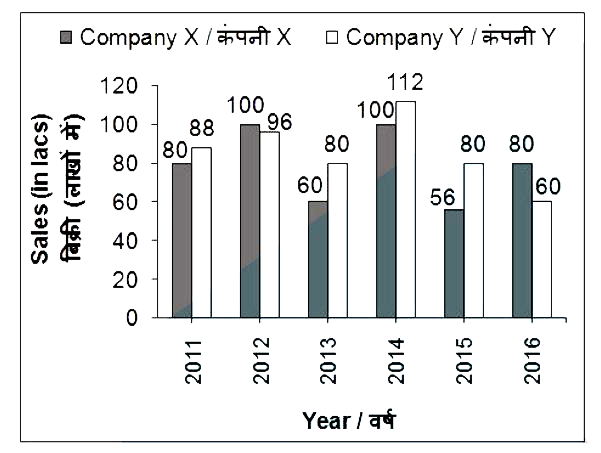
View SolutionThe bar chart given below shows the sales (in lacs) of 2 companies X and Y and Y from year 2011 to 2016

The sale of company Y in 2015 is what percent of the sale of company X in 2011?
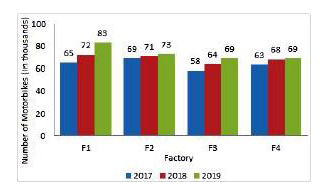
View SolutionThe folio wine bar graph shows The sales (in thousands) of motor bikes by the factories, F1, F2, F3 and F4 in 2017, 2018 and 2019.

Which of the factories witnessed the highest increase hi the percentage of sales from 2018 to 2019?
View Solution
