The bar graph shows the debt of different countries. Study the diagram and answer the following questions.
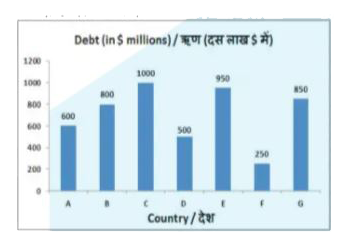
If country F is paying 3% as interest on its debt per year, then how much interest (in $) does it pay per year?
750000
7500000
1200000
1200000
The correct Answer is:B
Step by step video, text & image solution for The bar graph shows the debt of different countries. Study the diagram and answer the following questions. If country F is paying 3% as interest on its debt per year, then how much interest (in $) does it pay per year? by Maths experts to help you in doubts & scoring excellent marks in Class 14 exams.
Updated on:21/07/2023Similar Questions
The bar graph shows the population of different countries. Study the diagram and answer the following questions.
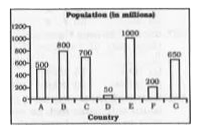
Which country has the second highest population?
View SolutionThe bar graph shows the population of different countries. Study the diagram and answer the following questions.
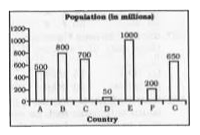
Population of country E is greater than that of country A by _____.
View Solution
Knowledge Check
The bar graph shows the debt of different countries. Study the diagram and answer the following questions.
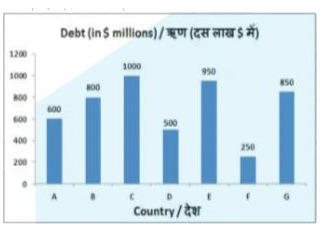
Which country has the second lowest debt?A1) DB2) AC3) BD4) EThe bar graph shows the debt of different countries. Study the diagram and answer the following questions.
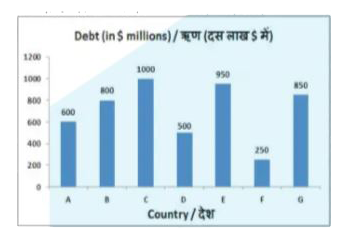
What is the ratio of debt of country A to that of country F?A12:5B5:12C6:5D5:6The bar graph shows the debt of different countries. Study the diagram and answer the following questions.
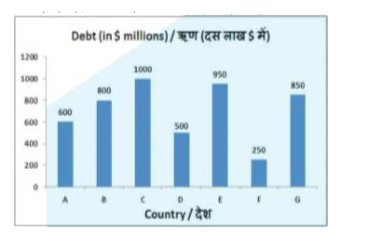
Debt of country A is lesser than that of country B by ___________.A20%B25%C33.33%D30%
The bar graph shows the population of different countries. Study the diagram and answer the following questions.
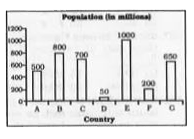
If country D spends $120 per person on health annually, then how much does it spend (in $ millions) on health on its entire population?
View SolutionThe bar graph shows the population of different countries. Study the diagram and answer the following questions.
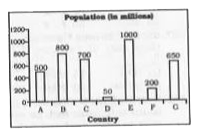
What is the ratio of population of country A to that of country G?
View SolutionThe bar graph shows the number of soldiers in the armies of different countries. Study the diagram and answer the following questions.
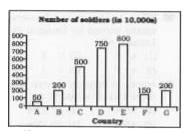
If country D spends $20000 per soldiers annnually, then how much does it spend (in $ millions) on all its soldiers annually?
View SolutionThe bar graph shows the number of soldiers in the armies of different countries. Study the diagram and answer the following questions.
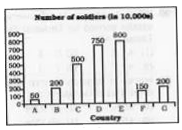
Which country has the least number of soldiers?
View SolutionThe bar graph shows the number of soldiers in the armies of different countries. Studty the diagram and answer the following questions.
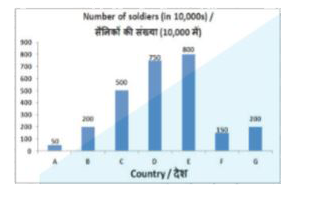
If country D spends $20000 per soldier annually, then how much does it spend (in $ millions) on all its soldiers annually?
View Solution
