The given Bar Graph presents Different Type of Vehicles (in lakhs) exported by a company in 2016 and 2017.
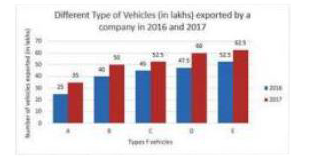
The total number of vehicles of type C and E exported by the company in 2017 is what percentage (correct to one decimal place) more than the total number of vehicles of type A, B and C exported in 2016?
5.4
4.5
4.1
5.2
The correct Answer is:B
Step by step video, text & image solution for The given Bar Graph presents Different Type of Vehicles (in lakhs) exported by a company in 2016 and 2017. The total number of vehicles of type C and E exported by the company in 2017 is what percentage (correct to one decimal place) more than the total number of vehicles of type A, B and C exported in 2016? by Maths experts to help you in doubts & scoring excellent marks in Class 14 exams.
Updated on:21/07/2023Similar Questions
The given Bar Graph presents different types of vehicles (in lakhs) exported by a company in 2016 and 2017. The average number of all types of vehicles exported by the company in 2016 is what percent less than the number of type B vehicles exported in 2017? दिया गया दंड आरेखा (बार ग्राफ) 2016 और 2017 में किसी कंपनी द्वारा निर्यात किए गए विभिन्न प्रकार के वाहनों (लाखों में) को दर्शाता है| 2016 में कंपनी दवारा निर्यात किए गए सभी प्रकार के वाहनों की औसत संख्या, 2017 में निर्यात किए गए टाइप B वाहनों की संख्या से कितने प्रतिशत कम है?
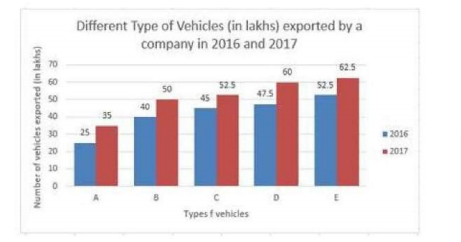
View SolutionThe given Bar Graph presents different types of vehicles (in lakhs) exported by a company in 2016 and 2017. The average number of all types of vehicles exported by the company in 2016 is what percent less than the number of type B vehicles exported in 2017?

View Solution
Knowledge Check
In given bar graph presents the number of different types of vehicles exported by a company during 2014?
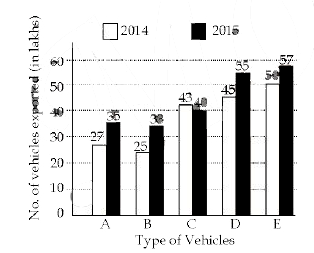
The total number of type B,D and E vehicles exported in 2014 is what percentage of the total number of type A,C,D and E vehicles exported in 2015A5.4B4.5C4.1D5.2The given bar graph presents Different type of Vehicles exported by a company in 2016 and 2017?
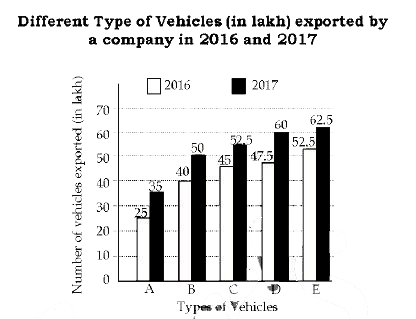
What is the ratio of the total number of vehicles of type D and E exported by the company in 2016 to that of vehicles of type C and E exported in 2017?A4:5B20:23C10:11D5:6In given bar graph presents the number of different types of vehicles exported by a company during 2014?

The total number of type B,D and E vehicles exported in 2014 is what percentage of the total number of type A,C,D and E vehicles exported in 2015A0.624B0.616C0.638D0.642

The average number of type A,B and D vehicles exported in 2015 was x% less than the number of type E vehicles exported in 2014 what is the value of x?
View SolutionThe given Bar Graph presents the number of different types of vehicles exported by a company in 2017 and 2018.What is the ratio of the total number of vehicles exported in 2017 of types B, C and D to that of vehicles exported in 2018 of the types A, D and E?
दिया गया दंड आरेख एक कंपनी के द्वारा 2017 और 2018 में निर्यात किये गए अलग-अलग प्रकार के वाहनों की संख्या को दर्शाता है |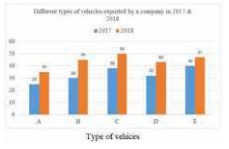
2017 में निर्यात किये गए B, C और D प्रकार के वाहनों की कुल संख्या का 2018 में निर्यात किये गए A, D और E प्रकार के वाहनों की संख्या के साथ अनुपात ज्ञात करें |
View SolutionThe given bar graph presents Different type of Vehicles exported by a company in 2016 and 2017?

The export of which type of vehicle in 2017 is approximately 18.3% more than that export of same type of vehicle in 2016.
View SolutionThe given bar graph presents the number of different types of vehicles (in lakhs) exported by a company during 2014 and 2015.
दिया गया दंड आरेख एक कंपनी के द्वारा 2014 और 2015 में निर्यात किये गए अलग-अलग प्रकार के वाहनों की संख्या ( लाख में ) को दर्शाता है |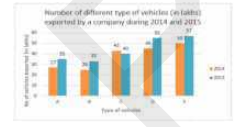 What is the ratio of the total number of type A and C vehicles exported in 2014 to the total number of type B and E vehicles exported in 2015?
2014 में निर्यात किये गए A और C प्रकार के वाहनों की कुल संख्या का 2015 में निर्यात किये गए B एवं E प्रकार के वाहनों की कुल संख्या के साथ अनुपात ज्ञात करें |
View SolutionThe total number of cars sold by companies A in 2017 and C in 2013 is what percentage of the total number of cars sold by all four companies in 2013 and 2016? (correct to one decimal place)
View Solution
