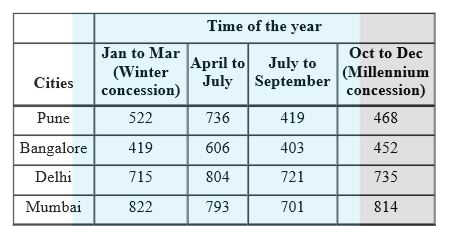
Given below is the data of the sale of Washing Machine of a company in four cities in a year. The record is based on the quarterly sale.
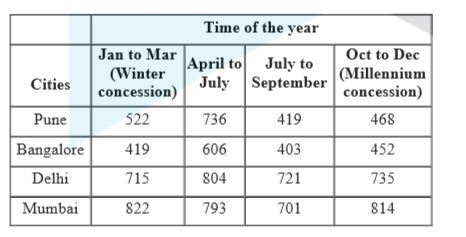
What approximately is Mumbai’s contribution in the annual sale?
27.8%
33.3%
30.9%
31.5%
The correct Answer is:C
Step by step video, text & image solution for Given below is the data of the sale of Washing Machine of a company in four cities in a year. The record is based on the quarterly sale. What approximately is Mumbai’s contribution in the annual sale? by Maths experts to help you in doubts & scoring excellent marks in Class 14 exams.
Updated on:21/07/2023Similar Questions
The following graph shows the sales of cars (in thousands) in four cities in 4 years. Study the graph and answer the question.
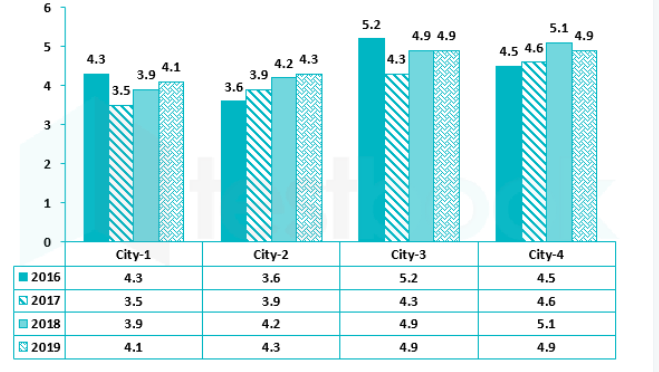
Which city has the highest sales?
View SolutionThe following graph shows the sales of cars (in thousands) in four cities in 4 years. Study the graph and answer the question
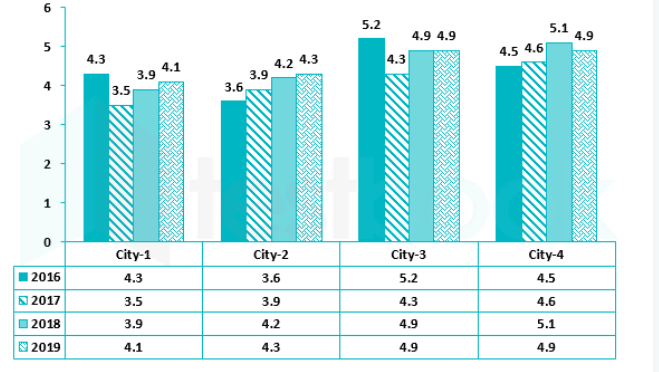
In which year. the sales are highest?
View Solution
Knowledge Check
Given below is the data of the sale of Washing Machine of a company in four cities in a year. The record is based on the quarterly sale

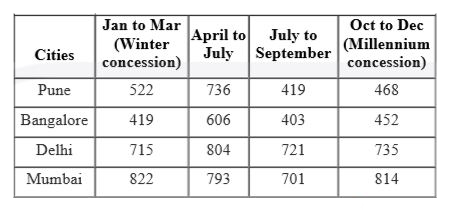
What is the percentage of the Washing Machine sold during July to Sept quarterly? (approx)A19.9%B28.4%C20.35D22.1%Given below is the data of the sale of Washing Machine of a company in four cities in a year. The record is based on the quarterly sale.
The turnover of Jan to March is how much more than the turnover of Oct to Dec.A11B15C14D9Given below is the data of the sale of Washing Machine of a company in four cities in a year. The record is based on the quarterly sale.
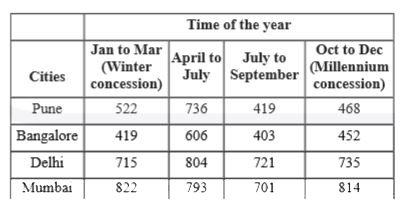
How much turnover did the company receive during the period Oct to Dec?A2469B2458C2456D2459
The following graph shows the sales of cars (in thousands) in four cities in 4 years. Study the graph and answer the question.
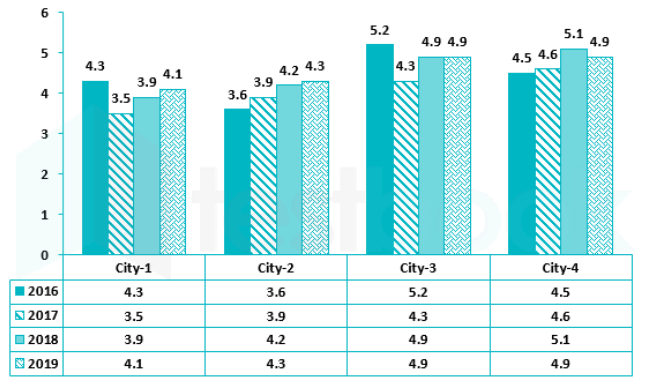
In 2019, what is the average number of sales among all four cities?
View SolutionDirections :- Study the following table and answer the questions based on it.
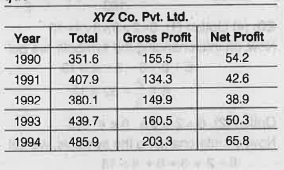 The total sales in 1993 is approximately what per cent of the total sales of 1990?
View SolutionThe graph given below gives the actual and expected sales of cars of a company for 6 months. Study the graph and answer the questions that follow.
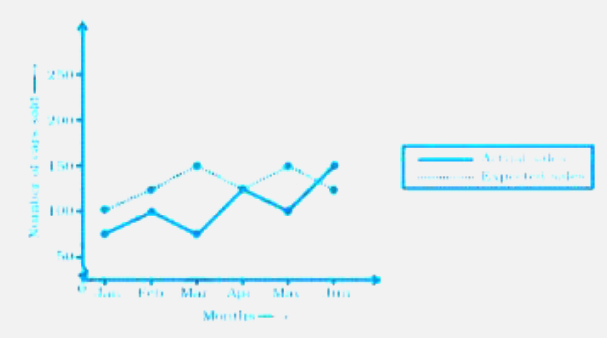
(a) In which month was the actual sales same as the expected sales?
(b) For which month(s) was (were) the difference in actual and expected sales the maximum?
(c) For which month(s) was (were) the difference in actual and expected sales the least?
(d) What was the total sales of cars in the months–Jan, Feb. and March?
(e) What is the average sales of cars in the last three months?
(f) Find the ratio of sales in the first three months to the last three months.
View SolutionStudy the following table and the answer the questions based on it : (in lakhs of Rs.)
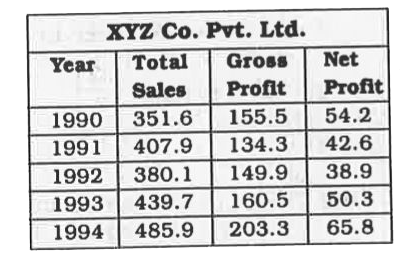
The total sales in 1993 is approximately what percent of the total sales of 1990 ?
View SolutionThe line chart given below shows the sales (in crores) of a company for the years 2009 to 2016
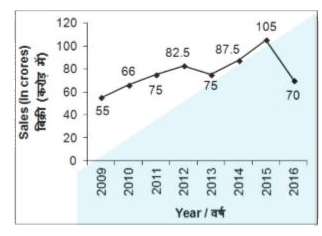
What is the average sale of the company from year 2009 to 2015?
View Solution
