Directions: Study the following bar graph carefully and answer the questions given below. Below given is the bar chart of the COVID-19 sample data (31/03/2021 - 04/04/2021) at the district of Prayagraj, Uttar Pradesh. It indicates the number of samples detected of Covid - 19 Positive and Covid - 19 Negative on each day of the mentioned period.
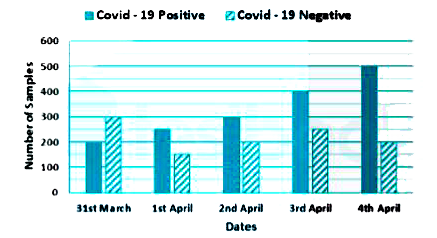
What is the percentage increase in the number of COVID-19 POSITIVE samples from 2nd April to 3rd April ?
40%
133.33%
25%
33.33%
The correct Answer is:D
Step by step video, text & image solution for Directions: Study the following bar graph carefully and answer the questions given below. Below given is the bar chart of the COVID-19 sample data (31/03/2021 - 04/04/2021) at the district of Prayagraj, Uttar Pradesh. It indicates the number of samples detected of Covid - 19 Positive and Covid - 19 Negative on each day of the mentioned period. What is the percentage increase in the number of COVID-19 POSITIVE samples from 2nd April to 3rd April ? by Maths experts to help you in doubts & scoring excellent marks in Class 14 exams.
Updated on:21/07/2023Similar Questions
Knowledge Check
Study the following graph carefully and answer the question given below-----
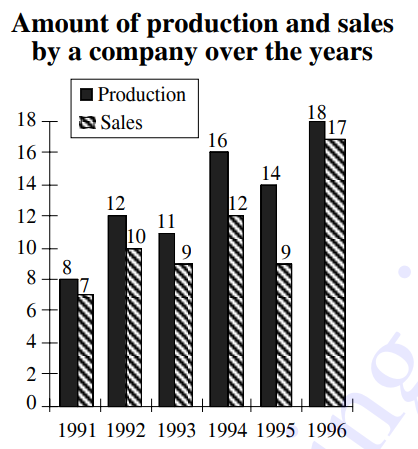
What was the percentage drop in sales from 1992 to 1993 ?A1B10C20D15Study the following graph carefully and answer the questions given below it -----
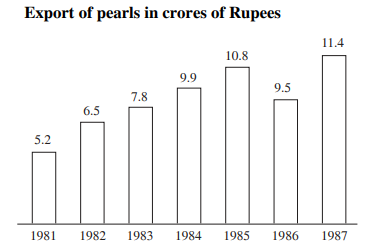
What was the percentage increase in export from 1986 to 1987 ?A1623%B20%C19%D3313%Study the following graph carefully to answer the questions given below.
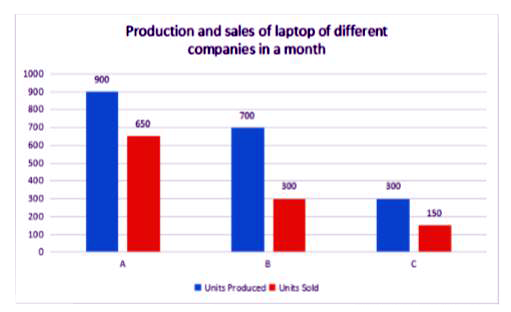
What is the average number of Units produced by all the Companies together?A62513B63313C63323D62313
Study the following bar graph and answer the questions given below.
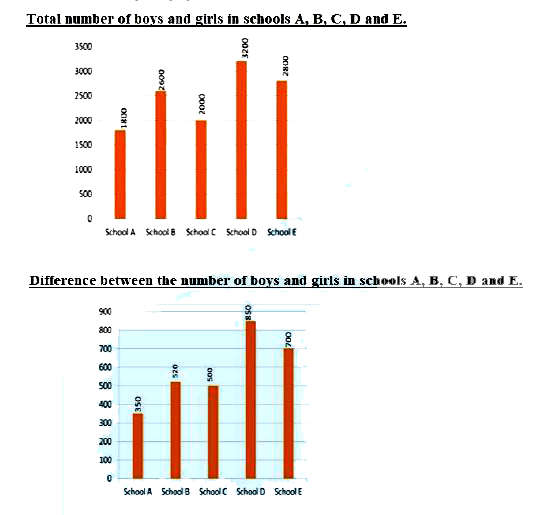
What is the ratio of numbers of boys to the number of girls in school E?
View SolutionRead the following graph carefully and answer the questions given below:
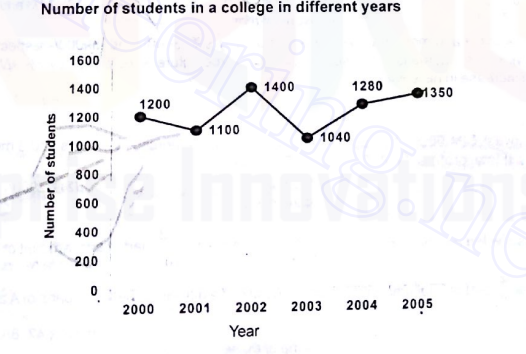
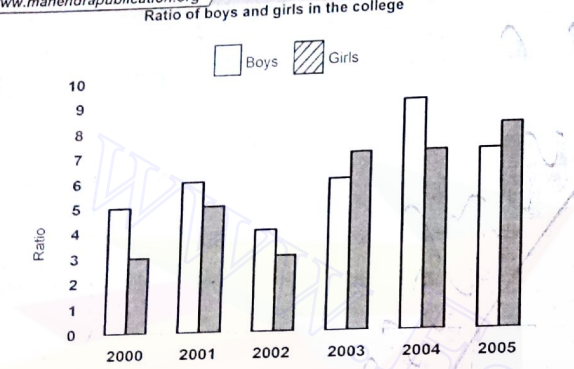
What is the difference between the number of boys and girls in the year 2004 ?
View SolutionStudy the following Pie-Chart carefully to answer the questions given below.
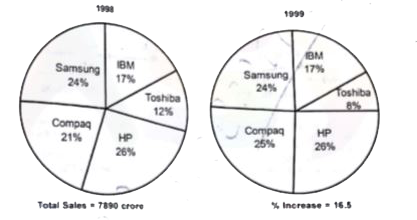
IBM's sales in 1998 is what percentage of the sales of Samsung in 1999 ?
View SolutionStudy the following graph carefully and answer the questions given below it -----
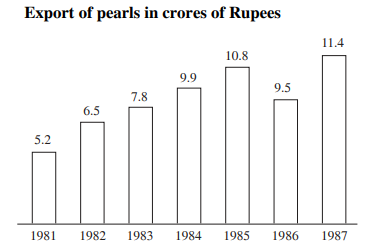
In how many years was the export above the average for the given period ?
View SolutionStudy the following bar hraph carefully and answer the questions.
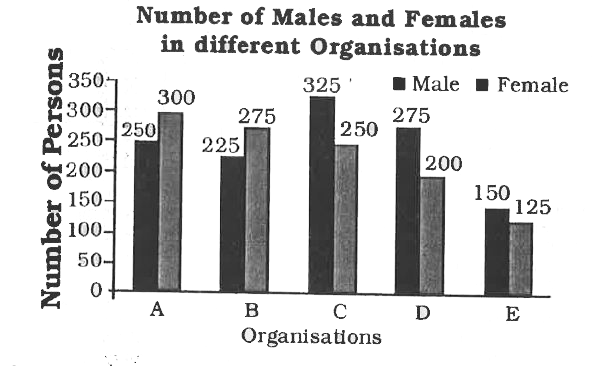
In the given bar graph, what is the average number of females in all five organisations?
View Solution
