Directions: The following table presents the number of units of the product produced and sold by a company during six years
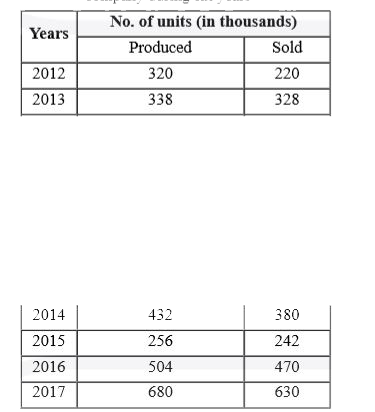
Find the ratio between total production and total sales
227 : 253
2530 : 2270
253 : 227
253 : 220
The correct Answer is:C
Step by step video, text & image solution for Directions: The following table presents the number of units of the product produced and sold by a company during six years Find the ratio between total production and total sales by Maths experts to help you in doubts & scoring excellent marks in Class 14 exams.
Similar Questions
Study the following table, which shows the number of units of a product manufactured and sold by a company in five years, and answer questions.
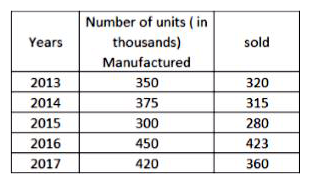
What percent of total units of the product manufactured in 2013 and 2015 is the total units unsold during the five years? (correct to one decimal place)View SolutionStudy the following table, which shows the number of units of a product manufactured and sold by a company in five years, and answer questions.
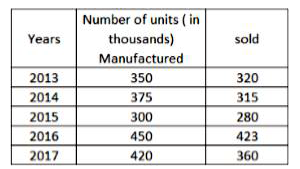
In which year the number of units of the product sold is 19000 more than the average number of units manufactured per year?View Solution
Knowledge Check
- Question 1 - Select One
The following table presents the number of units of a product produced and sold by a company during six years.
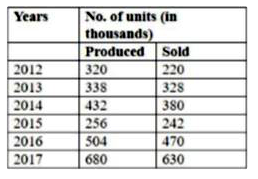
What is the ratio of the total number of units of the product sold in 2013 and 2015 to that prodcued in 2015 and 2016 ?A3:4B7:9C29:38D14:19 - Question 2 - Select One
The following table presents the number of units of a product produced and sold by a company during six years.
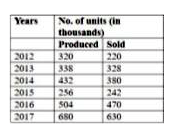
In which year, the production of units of the product is approximately 31.4% less than sale of units in 2017 ?A2012B2014C2016D2013 - Question 3 - Select One
The following table presents the number of units of a product produced and sold by a company during six years.
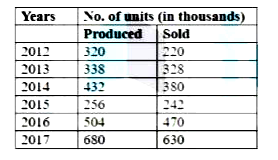
The number of units of the product sold in 2016 is approximately what percent more than the average production of the units in 2012 to 2016 ?A24B32C27D21
Formation of table for the production and sales of a company in different years
View SolutionStudy the following table, (which shows the number of units of an item manufactured and sold by 5 companies) and answer the question
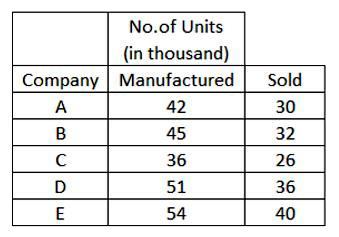
The ratio of the number of units manufactured by companies C and E together and the number of units sold by A and D together is?View SolutionStudy the following table, (which shows the number of units of an item manufactured and sold by 5 companies) and answer the question.
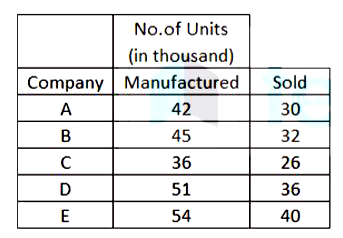
What percent of total number of units sold by companies A, B and D is equal to the number of units manufactured by company C? (correct to one decimal place)View SolutionDirections: Refer to the following graph and answer the given questions. Data related to the number of shoes sold by two stores (A and B )during five years:
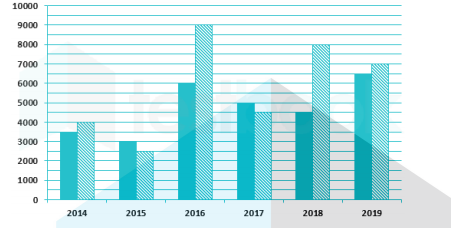
Find the ratio between the total number of shoes sold by stores A and B together in 2016 to the total number of shoes sold by stores A and B together in 2018?View SolutionIn the following table year wise ratio of number of taxable and non-taxable products produced by a company has been shown. The total production of the company increases by 10% every year.
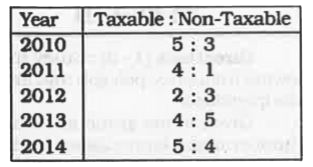
Find the ratio of taxable products produced in year 2011 and 2012 and non-taxable products in years 2011 and 2012.View Solution
