The ratio of the total amount spent on A and D commodities in the year 2019 is:
3:8
6:17
1:1
15:17
The correct Answer is:B
To solve the problem of finding the ratio of the total amount spent on A and D commodities in the year 2019, we can follow these steps:
Step 1: Identify the quantities and costs for commodities A and D in 2019
From the provided table:
- For commodity A:
- Quantity required per month = 15 kg
- Cost per kg in 2019 = Rs. 80
- For commodity D:
- Quantity required per month = 40 kg
- Cost per kg in 2019 = Rs. 85
Step 2: Calculate the total amount spent on commodity A in 2019
Total amount spent on A = Quantity required per month × Cost per kg
Total amount spent on A=15kg×80Rs/kg=1200Rs
Step 3: Calculate the total amount spent on commodity D in 2019
Total amount spent on D = Quantity required per month × Cost per kg
Total amount spent on D=40kg×85Rs/kg=3400Rs
Step 4: Find the ratio of the total amounts spent on A and D
To find the ratio of the total amount spent on A to the total amount spent on D, we set up the ratio:
Ratio=Total amount spent on ATotal amount spent on D=12003400
Step 5: Simplify the ratio
To simplify the ratio, we can divide both the numerator and the denominator by 100:
12003400=1234
Now, we can simplify this further by dividing both by 2:
12÷234÷2=617
Final Answer
Thus, the ratio of the total amount spent on A and D commodities in the year 2019 is:
Ratio=6:17
- For commodity A:
- Quantity required per month = 15 kg
- Cost per kg in 2019 = Rs. 80
- Quantity required per month = 40 kg
- Cost per kg in 2019 = Rs. 85
Total amount spent on A=15kg×80Rs/kg=1200Rs
Total amount spent on D=40kg×85Rs/kg=3400Rs
Ratio=Total amount spent on ATotal amount spent on D=12003400
12003400=1234
Now, we can simplify this further by dividing both by 2:
12÷234÷2=617
Ratio=6:17
Similar Questions
The following table gives the details of five commodities A,B,C,D and E with quantity required and their cost for a family in a month. Study the table and answer the questions that follow. The total amount spent on the five commodities by the family in the year 2019 is:
निम्नलिखित तालिका पाँच वस्तुओं A, B, C, D तथा E के बारे में बताती है कि एक महीने में एक परिवार को उनकी कितनी मात्रा की आवश्यकता है तथा उनकी लागत कितनी है | इस तालिका का अध्ययन करें तथा फिर पूछे गए प्रश्नों के उत्तर दें |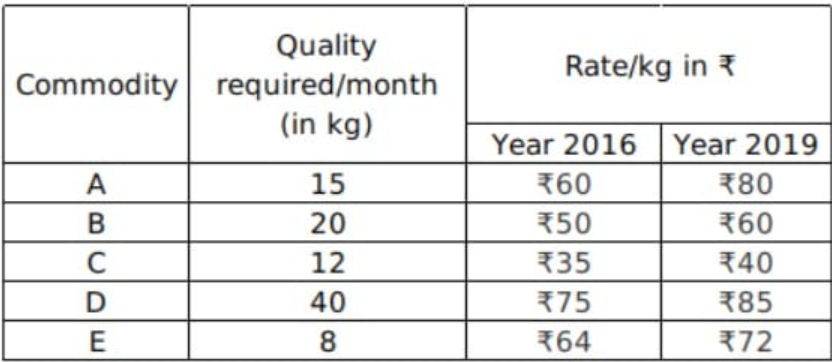
इस परिवार के द्वारा वर्ष 2019 में पाँचों वस्तुओं पर कुल कितनी राशि खर्च की गयी थी ?
View SolutionThe pie chart,drawn, shows the spending of a country on various sports during a particular year. Study the graph carefully and answer the questions that follow.
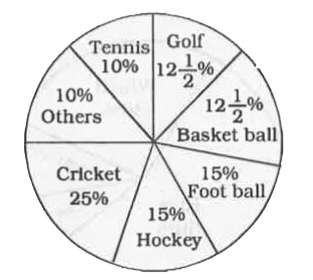
The ratio of the total amount spent on football to that spent on hockey is?
View Solution
Knowledge Check
The extra amount spent on commodities B and C in the year 2019 as compared to that in the year 2016, is:
ARs. 248BRs. 192CRs. 260DRs. 110The table below shows the number of students enrolled in five colleges over the five years (2010 to 2014).
यह तालिका पांच कॉलेजों में पांच वर्षों ( 2010 से 2014 ) के दौरान नामांकन लेने वाले छात्रों की संख्या दर्शाती है |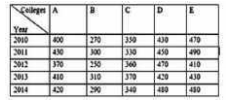 What is the ratio of the total students enrolled in colleges A and B in the year 2012 to the total students enrolled in colleges D and E in the year 2013?
वर्ष 2012 में कॉलेज A और B में नामांकन लेने वाले कुल छात्रों की संख्या का वर्ष 2013 में कॉलेज D और E में नामांकन लेने वाले कुल छात्रों की संख्या के साथ अनुपात ज्ञात करें|A72:85B62:88C73:86D58:63The pie chart drawn below shows the spendings of a country on various sports during a particular year. Study the pie chart and answer the questions.
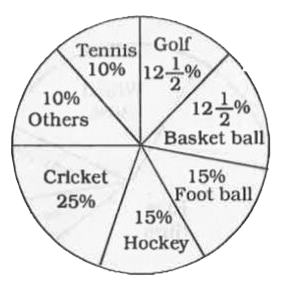
If, the total amount spent on sports during the year was Rs. 1,20,00,000, how much was spent on basketball ?ARs. 950000BRs. 10,00,000CRs. 12,00,000DRs. 15,00,000
Following is the pie-chart showing the spendings of a family on various items in a particular year
Study the pie chart and answer questions.
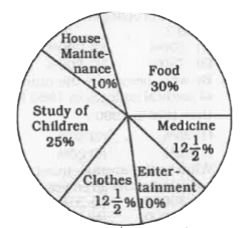
The ratio of the total amount spent for food and medicine is
View SolutionFollowing is the pie-chart showing the spendings of a family on various items in a particular year
Study the pie chart and answer questions.
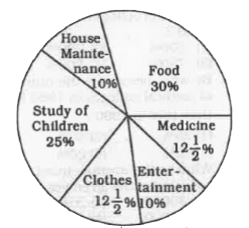
If the total amount spent on the family during the year was Rs 35,000, the amount spent for study of children and food together was
View SolutionThe following table gives the details of five commodities A,B,C,D and E with quantity required and their cost for a family in a month. Study the table and answer the questions that follow.
निम्नलिखित तालिका पाँच वस्तुओं A, B, C, D तथा E के बारे में बताती है कि एक महीने में एक परिवार को उनकी कितनी मात्रा की आवश्यकता है तथा उनकी लागत कितनी है | इस तालिका का अध्ययन करें तथा फिर पूछे गए प्रश्नों के उत्तर दें |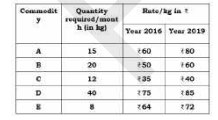 The amount spent extra on commodities B and C in the year 2019 as compared to that in the
year 2016 is:
वर्ष 2016 की तुलना में वर्ष 2019 में वस्तु B तथा C पर कितनी अतिरिक्त राशि खर्च की गयी है ?
View SolutionThe pie-chart given here shows the country's expenditure on various sports during a particular year. Study the pie-chart and answer the question given below.
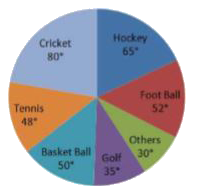
If the total amount spent on sports in the year was ₹1,80,00,000, then the amount spent on tennis is more than the expenditure on golf by:
View SolutionThe total amount spent on the Five commodities in a month by the family in the year 2019 is:
View Solution
