The percentage increase in the total car in 2016 over 2012, is:
0.3333
0.5
0.6233
0.45
The correct Answer is:B
To find the percentage increase in the total cars in 2016 over 2012, we will follow these steps:
Step 1: Identify the total number of cars in 2012 and 2016
From the information provided:
- Total cars in 2012 = 120,000
- Total cars in 2016 = 180,000
Step 2: Calculate the increase in the number of cars from 2012 to 2016
To find the increase, we subtract the total number of cars in 2012 from the total number of cars in 2016:
Increase=Total cars in 2016−Total cars in 2012
Increase=180,000−120,000=60,000
Step 3: Calculate the percentage increase
The formula for percentage increase is:
Percentage Increase=(IncreaseOriginal Number)×100
Substituting the values we have:
Percentage Increase=(60,000120,000)×100
Step 4: Simplify the fraction
60,000120,000=60120=12
Step 5: Calculate the final percentage
Now, substituting back into the percentage formula:
Percentage Increase=(12)×100=50%
Final Answer
The percentage increase in the total cars in 2016 over 2012 is 50%.
---
From the information provided:
- Total cars in 2012 = 120,000
- Total cars in 2016 = 180,000
To find the increase, we subtract the total number of cars in 2012 from the total number of cars in 2016:
Increase=Total cars in 2016−Total cars in 2012
Increase=180,000−120,000=60,000
The formula for percentage increase is:
Percentage Increase=(IncreaseOriginal Number)×100
Substituting the values we have:
Percentage Increase=(60,000120,000)×100
60,000120,000=60120=12
Now, substituting back into the percentage formula:
Percentage Increase=(12)×100=50%
The percentage increase in the total cars in 2016 over 2012 is 50%.
Similar Questions
The given table shows the number (in thousands) of cars of five different models A, B, C, D and E produced during years 2012-2017. Study the table and answer the questions that follow.
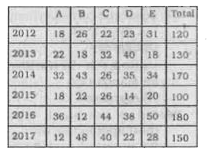
The percentage increase in the total cars in 2016 over 2012, is:View SolutionThe given table shows the number (in thousands) of cars of five different models A, B, C, D and E produced during Years 2012-2017. Study the table and answer the questions that follows:
दी गयी तालिका पाँच अलग-अलग मॉडलों- A, B, C, D और E की कारों की संख्या ( हज़ार में ) दर्शाती है, जिनका उत्पादन वर्ष 2012-2017 के दौरान किया गया है | इस तालिका का अध्ययन करें और फिर पूछे गए प्रश्न का उत्तर दें |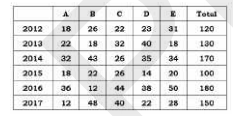 The percentage increase in the total cars in 2016 over 2012 is:
2012 की तुलना में 2016 में कुल कारों में कितने प्रतिशत की वृद्धि हुईView Solution
Knowledge Check
- Question 1 - Select One
The percentag increases in the total number of students of a school over that in the previous year.
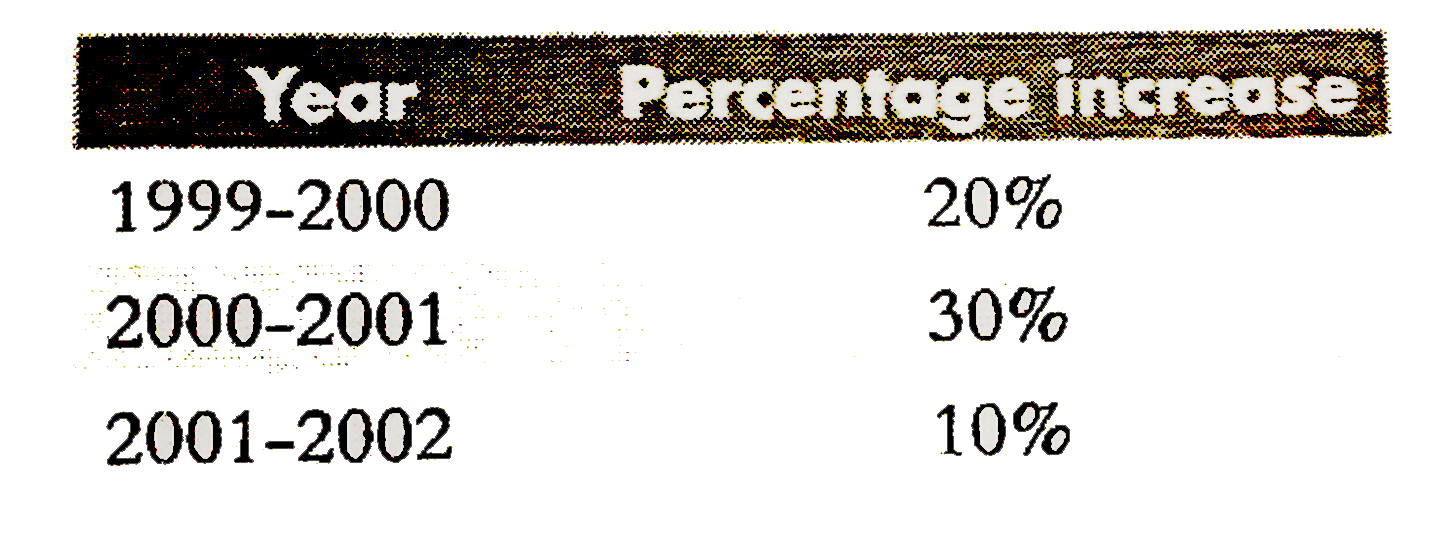
Find the effective percentage increase in the number of students from 1998-1999 to 2000-2001.A0.316B0.72C0.62D0.82 - Question 2 - Select One or More
The table given below shows number of literate people and total population in a village from the year 2011 to 2016 .
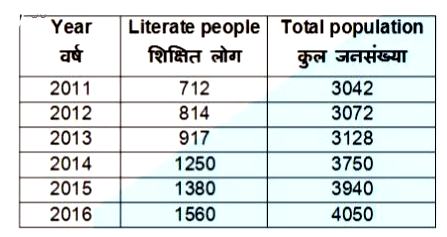
What is the percentage increase in the literate people in the year 2015 in comparison to year 2014?A10.4B11.5C16.5D21.2 - Question 3 - Select One
The table given below shows number of literate people and total population in a village from the year 2011 to 2016.

What is the percentage increase in the literate people in the year 2015 in comparison to year 2014?A(a) 10.4B(b) 11.5C(c) 16.5D(d) 21.2
Study the following bar-diagram carefully and answer the questions.
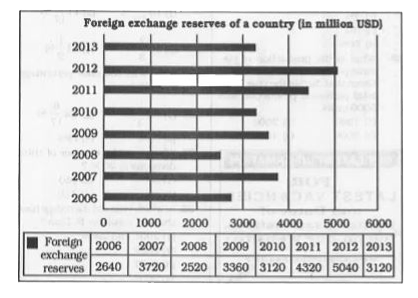
What was the percentage increase in the foreign reserve in 2012 over 2008?View SolutionFind the percentage increase in sales from 2012 to 2013
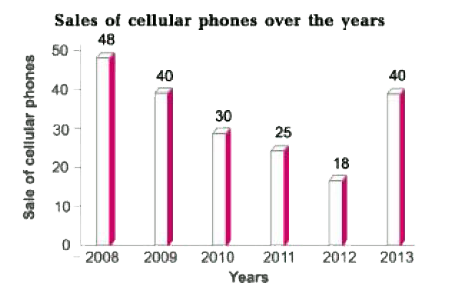 View Solution
What is the percentage increase in the production of rice in B from 2014 to 2016?
View SolutionThe percentag increases in the total number of students of a school over that in the previous year.

Find the effective percentage increase in the number of students from 1998-1999 to 2000-2001.View SolutionThe bar chart given below shows the number of cars sold by brand A and B for the year for 2008 to 2016
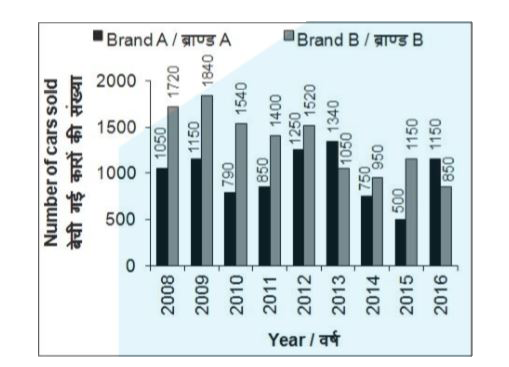
What is the percentage decrease in the number of car sold in year 2015 from year 2014 for brand A?View Solution
