Study the following graph carefully to answer the questions given below.
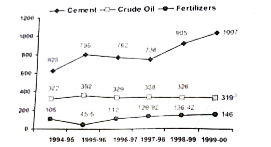
In which of the following pairs of years the difference between the production of crude oil in 1995-96 and that in 1999-00 was exactly equal to the difference between the production of cement?
1994-95 & 1997-98
1994-95 & 1999-00
1995-96 & 1997-98
None of these
Topper's Solved these Questions
Similar Questions
Read the following graph carefully and answer the questions given below:
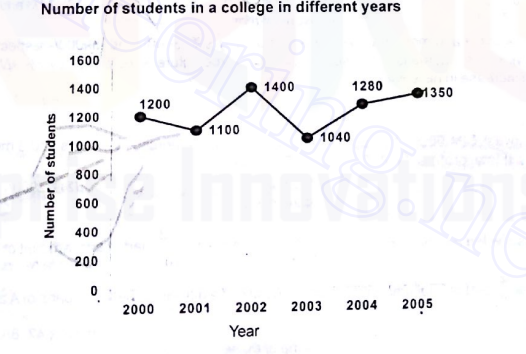
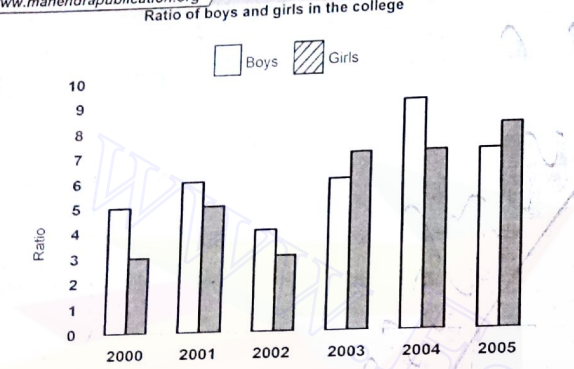
In which two years the number of girls is equal ?
View SolutionStudy the following graph and answer the questions given below -----
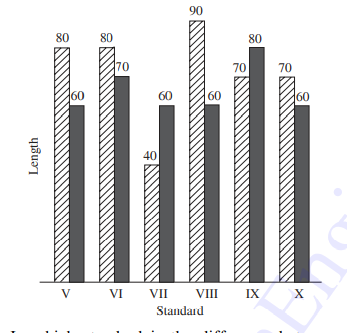
In which standard is the difference between the results of girls and boys maximum ?
View Solution
Knowledge Check
Study the following graph carefully and answer the questions given below
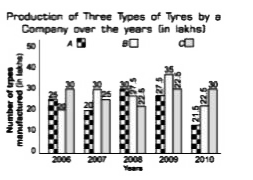
In which of the following years, was the percentage production of B type to C type the maximum?A2008B2009C2010D2007Study the following graph carefully and answer the questions given below it -----
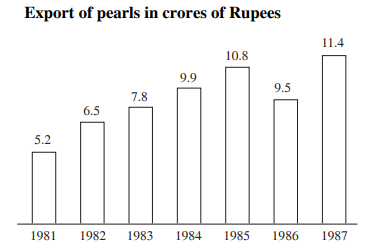
In which of the following pairs of years was the average export of pearls around 9 crores ?A1982 and 1983B1983 and 1984C1984 and 1985D1985 and 1986Study the following graph carefully and answer the questions given below –
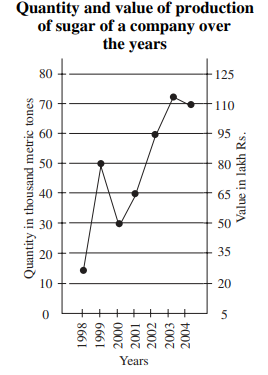
In which of the following years was the value of sugar per metric ton the lowest among the given years?A1998B1999C2001D2003
Study the following graph carefully and answer the question given below-----
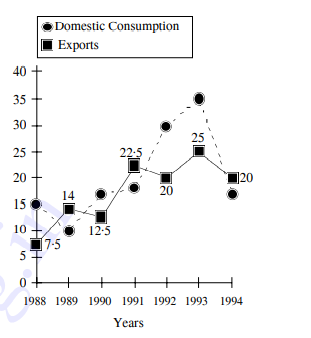
In which of the following years was the value of sugar per metric ton the lowest among the given years ?
View SolutionStudy the following line graph and answer the question based on it.
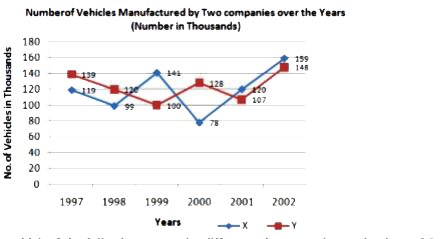
In which of the following years, the difference between the productions of Companies X and Y was the minimum among the given years?
View SolutionStudy the following graph carefully to answer the questions given below.
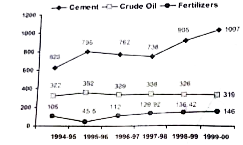
Find the approximate percentage increase in Cement production from 1994-95 to 1999-00 ?
View SolutionStudy the following graph carefully and answer the question given below-----
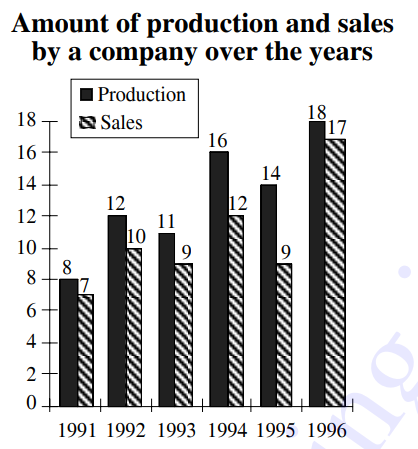
What was the difference between the sales of 1992 and 1995 ?
View SolutionStudy the following graph carefully and answer the questions given below
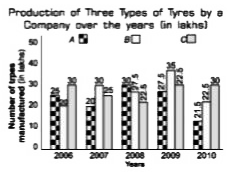
What was the difference between the number of B type tyres manufactured in 2008 and 2009?
View Solution
