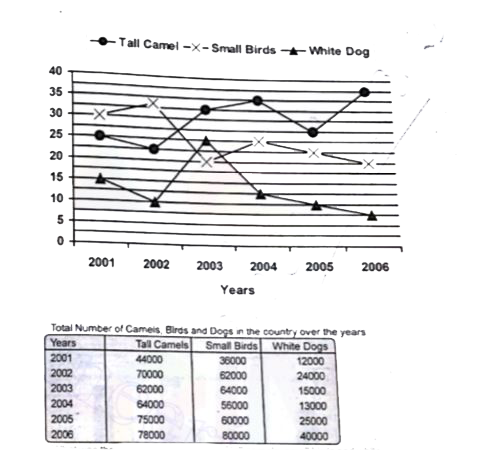
Study the following graph and table carefully and answer the question given below it. Percentage of Tall Camels, Small Birds and White Dogs in a state in various years.
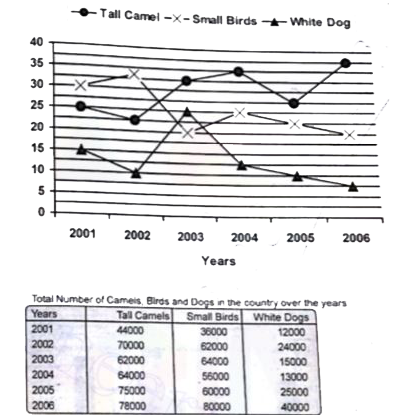
Total Number of Camels, Birds and Dogs in the country over the years
YearsTall CamelsSmall BirdsWhite Dogs200144000360001200020027000062000240002003620006400015000200464000560001300020057500060000250002006780008000040000
The number of tall camels in the year 2004 was what percent of the small birds in the same year ?
62.5
64.5
74
160
The correct Answer is:D
Step by step video, text & image solution for Study the following graph and table carefully and answer the question given below it. Percentage of Tall Camels, Small Birds and White Dogs in a state in various years. Total Number of Camels, Birds and Dogs in the country over the years {:("Years","Tall Camels","Small Birds","White Dogs"),(2001,44000,36000,12000),(2002,70000,62000,24000),(2003,62000,64000,15000),(2004,64000,56000,13000),(2005,75000,60000,25000),(2006,78000,80000,40000):} The number of tall camels in the year 2004 was what percent of the small birds in the same year ? by Maths experts to help you in doubts & scoring excellent marks in Class 14 exams.
Updated on:21/07/2023Topper's Solved these Questions
Similar Questions
Read the following graph carefully and answer the questions given below:

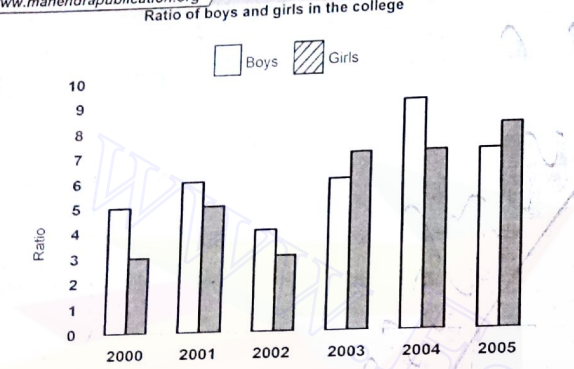
What is the difference between the number of boys and girls in the year 2004 ?
View SolutionRead the following graph carefully and answer the questions given below:


What is the respective ratio of number of boys in the year 2003 and that of girls in the year 2005 ?
View Solution
Knowledge Check
Study the following graph and table carefully and answer the question given below it. Percentage of Tall Camels, Small Birds and White Dogs in a state in various years.
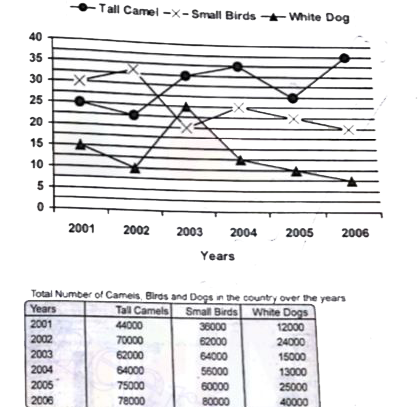
Total Number of Camels, Birds and Dogs in the country over the years
YearsTall CamelsSmall BirdsWhite Dogs200144000360001200020027000062000240002003620006400015000200464000560001300020057500060000250002006780008000040000
What was the total number of white dog in the year 2001, 2003 and 2005 together ?A8000B8500C8050D5080Study the following graph and table carefully and answer the question given below it. Percentage of Tall Camels, Small Birds and White Dogs in a state in various years.
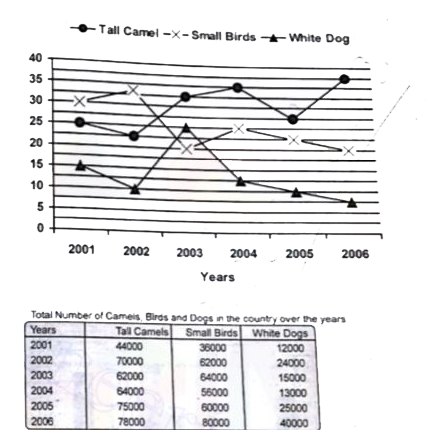
Total Number of Camels, Birds and Dogs in the country over the years
YearsTall CamelsSmall BirdsWhite Dogs200144000360001200020027000062000240002003620006400015000200464000560001300020057500060000250002006780008000040000
What was the respective ratio of the small birds in the year 2005 to the tall camels in the year 2001 ?A4:5B27:22C22:27D6:7Study the following graph and table carefully and answer the question given below it. Percentage of Tall Camels, Small Birds and White Dogs in a state in various years.
Total Number of Camels, Birds and Dogs in the country over the years
YearsTall CamelsSmall BirdsWhite Dogs200144000360001200020027000062000240002003620006400015000200464000560001300020057500060000250002006780008000040000
What was the approximate average of tall camels, small birds and white dogs in the year 2006 ?A16783B18783C16083D17000
Study the following graph and answer the questions given below it.
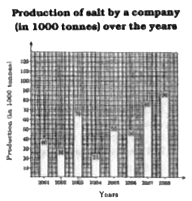
What was the percentage decline in the product of salt from 2003 to 2004 ?
View SolutionStudy the following graph and table carefully and answer the question given below it. Percentage of Tall Camels, Small Birds and White Dogs in a state in various years.
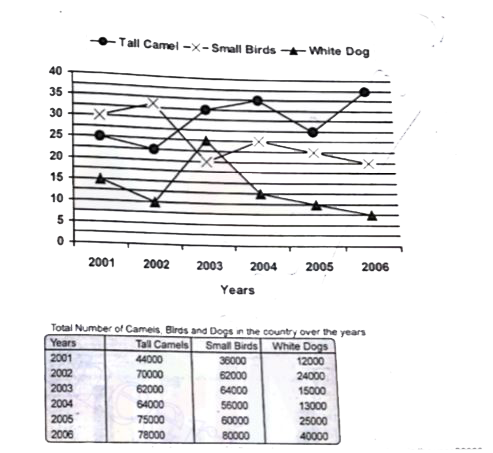
Total Number of Camels, Birds and Dogs in the country over the years
YearsTall CamelsSmall BirdsWhite Dogs200144000360001200020027000062000240002003620006400015000200464000560001300020057500060000250002006780008000040000
What is the difference between the number of small birds and white dogs together in the year 2005 and the number of tall camels in the same year ?
View SolutionStudy the following table carefully and answer the questions given below :
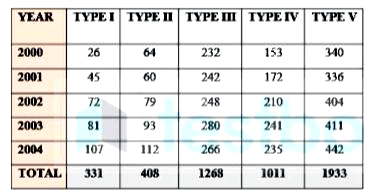
The percentage increase in sales in 2003 over the previous year was maximum for which Type of vehicles
View SolutionStudy the following graph carefully and answer the questions that
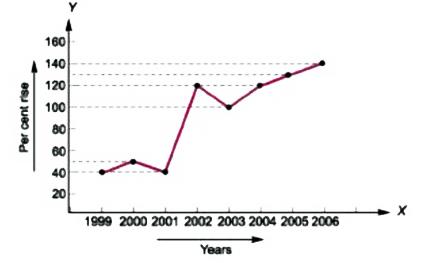
What was the average of percent rise over the given years ?
View SolutionStudy the following graph carefully and answer the questions that follow
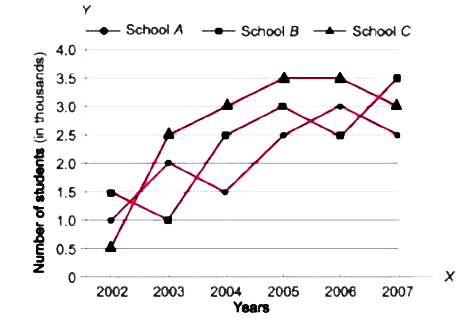
What was the average number of students in all schools together in the year 2006 ?
View Solution
