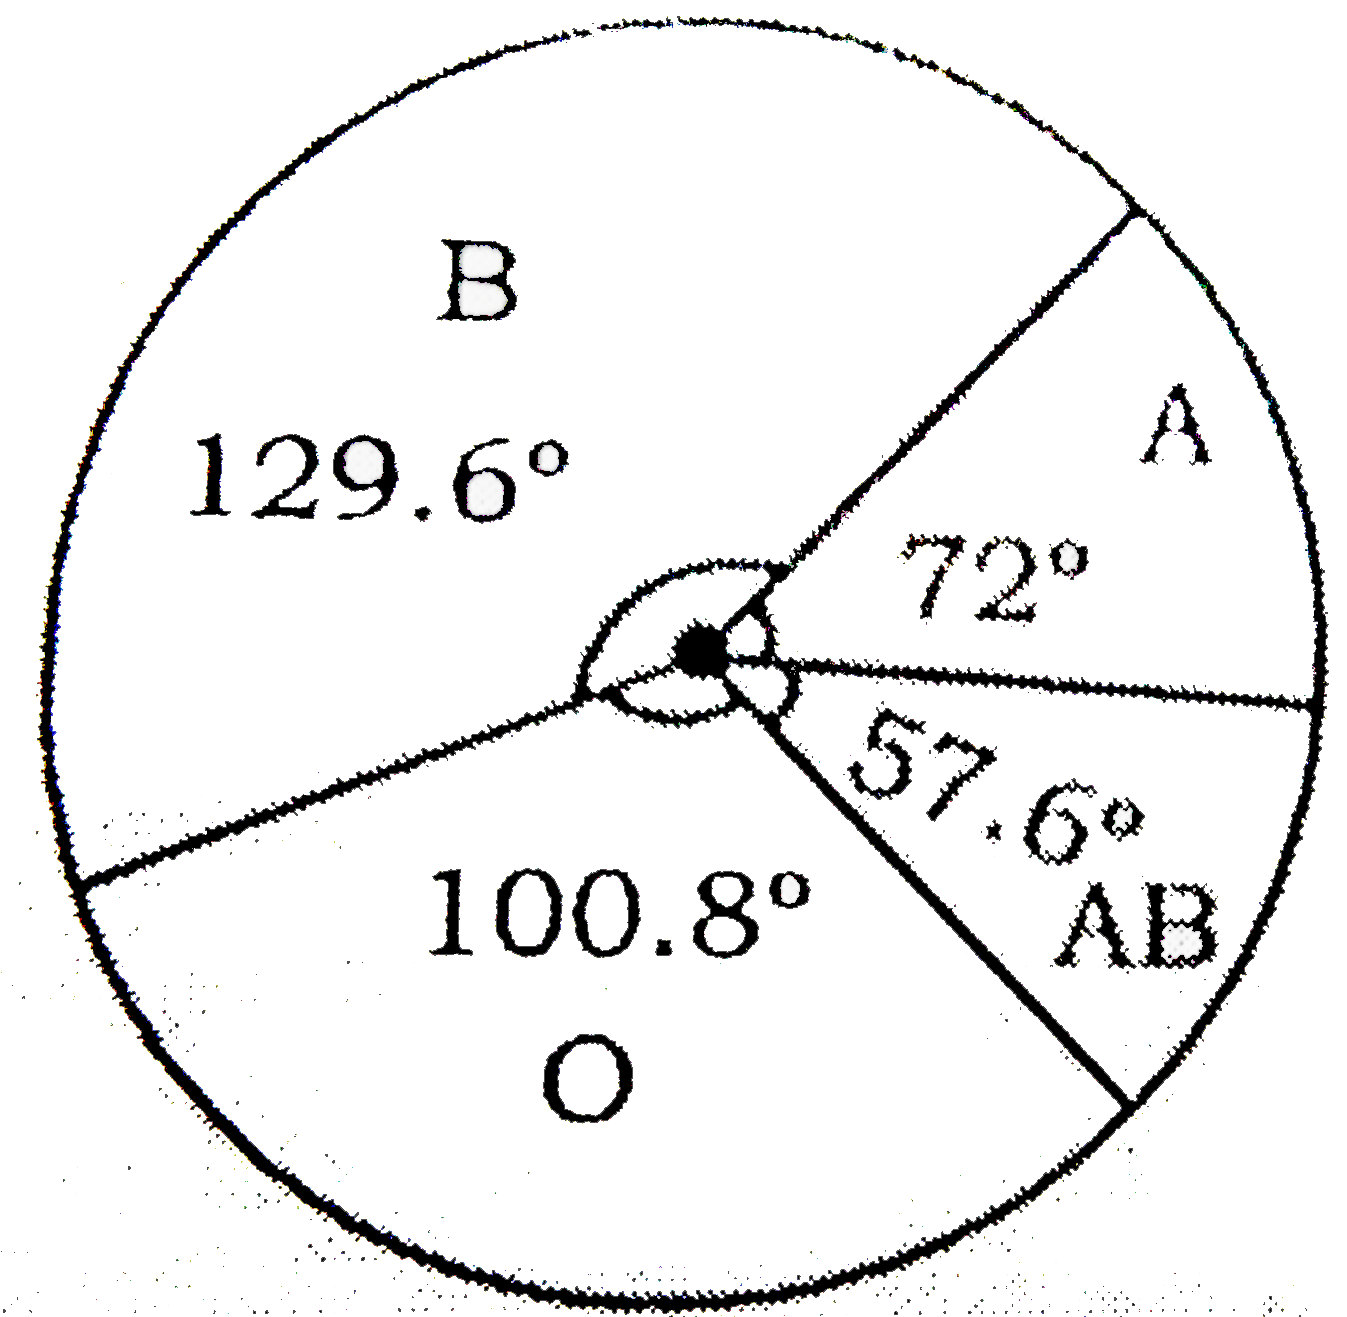
दिए गए पाई चार्ट में 150 दाताओं के ब्लड ग्रुप A,B,O,AB के आंकडों को दर्शाया गया है । पाई चार्ट का अध्ययन कीजिए और प्रश्नों का उत्तर दीजिए

ऐसे दाताओं की संख्या बताइए जिनका ब्लड ग्रुप O है ?
50
42
30
34
The correct Answer is:B
Step by step video & text solution for दिए गए पाई चार्ट में 150 दाताओं के ब्लड ग्रुप A,B,O,AB के आंकडों को दर्शाया गया है । पाई चार्ट का अध्ययन कीजिए और प्रश्नों का उत्तर दीजिए ऐसे दाताओं की संख्या बताइए जिनका ब्लड ग्रुप O है ? by Maths experts to help you in doubts & scoring excellent marks in Class 14 exams.
Updated on:21/07/2023Similar Questions
Study the following pie chart and table to answer the question.Total number of students admitted in a university in various fields = 5000 Distribution of the number of students into various fields: The ratio of the number of boys in Economics to the number of students in Economics is: निम्नांकित पाई चार्ट का अध्ययन कीजिए और उसके बाद दिए गए प्रशन का उत्तर दीजिए। एक विश्वविद्यालय में विभिन्न संकायों में प्रवेश लेने वाले विद्यार्थियों की संख्या 5000 है। विभिन्न संकायों में विद्यार्थियों को संख्या का बंटनः इकोनॉमिक्स में लड़कों की संख्या का, इकोनॉमिक्स में कुल विद्यार्थियों की संख्या से क्या अनुपात हे?
View SolutionStudy the following pie chart and table to answer the question.Total number of students admitted in a university in various fields = 5000 Distribution of the number of students into various fields: What is the average number of boys in CS, ECE and EEE fields? निम्नांकित पाई चार्ट का अध्ययन कीजिए और उसके बाद दिए गए प्रशन का उत्तर दीजिए। एक विश्वविद्यालय में विभिन्न संकायों में प्रवेश लेने वाले विद्यार्थियों की संख्या 5000 है। विभिन्न संकायों में विद्यार्थियों को संख्या का बंटनः CS, ECE और EEE संकायों में लड़कों की औसत संख्या कितनी है?
View SolutionThe given pie-chart, shows the percentage distribution of the expenditure incurred in publishing a book. Study the pie-chart and the answer the question based on it. / दिया गया पाई चार्ट किसी पुस्तक के प्रकाशन में हुए व्ययों के प्रतिशत वितरण को दर्शाता है | इस पाई चार्ट का अध्ययन करें तथा इस पर आधारित प्रश्न का उत्तर दें | In the given pie-chart, by what percentage the Royalty on the book is less than the Printing cost? / दिए गए पाई चार्ट के अनुसार, इस पुस्तक पर रॉयल्टी प्रकाशन की लागत से कितना प्रतिशत कम है ?
View SolutionThe given pie chart shows the expenditure given in millions on each game. दिया गया पाई चार्ट प्रत्येक खेल पर करोड़ो में दिए गए व्यय को दर्शाता है | In the given pie chart, what is the difference between expenditure on cricket and football ? दिए गए पाई चार्ट में , क्रिकेट और फुटबॉल पर किये गए व्यय के बीच क्या अंतर है ?
View SolutionThe pie-chart shows percentage-wise distribution of teachers who teach six different subjects. Study the pie chart and answer the questions
पाई-चार्ट छह अलग-अलग विषयों को पढ़ाने वाले शिक्षकों के प्रतिशत को दर्शाता है। पाई चार्ट का अध्ययन करें और प्रश्नों के उत्तर दें।
Total number of teachers = 1650 शिक्षकों की कुल संख्या - 1650
What is the total number of teachers teaching English, Maths and Physics?
अंग्रेजी, गणित और भौतिकी पढ़ाने वाले शिक्षकों की कुल संख्या क्या है?
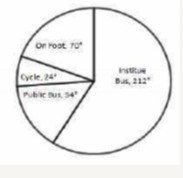
View SolutionStudy the pie-chart and answer the questions. In an institute, there are 900 students who use different modes of transport for to and from travel. The given pie diagram represents the requisite data.
पाई-चार्ट का अध्ययन करें और प्रश्नों के उत्तर दें। एक संस्थान में, 900 छात्र हैं जो आने-जाने के लिए परिवहन के विभिन्न साधनों का उपयोग करते हैं। दिए गए पाई चार्ट में संबंधित आंकड़े दिए गए हैं। The number of students who travel on foot is:
पैदल यात्रा करने वाले छात्रों की संख्या है:
View SolutionThe given pie chart shows the percentage distribution of 450 employees in an organization. Study the pie chart and answer the questions that follow
दिए गए पाई चार्ट एक संगठन में 450 कर्मचारियों के प्रतिशत को दर्शाता है। पाई चार्ट का अध्ययन करें और आने वाले प्रश्नों का उत्तर दें।
What is the central angle of the sector representing the number of employees in department A?
विभाग A में कर्मचारियों की संख्या का प्रतिनिधित्व करने वाले क्षेत्र का केंद्रीय कोण क्या है?
View SolutionStudy the following graph which shows income and expenditure of a company over the years and answer the questions. The difference in profit (in crores) of the company during 2007 and 2008 is. निम्नलिखित चार्ट का अध्ययन कीजिए जिसमें कंपनी की कुछ वर्षों की आय एवं उसके व्यय को दर्शाया गया है और प्रश्नों के उत्तर दीजिए : वर्ष 2007 और 2008 में कंपनी के लाभ में अंतर (₹ करोड़ में) कितना है?
View Solution
