दिया गया दंड आरेख (बार ग्राफ) पाँच कंपनियों द्वारा मोटरसाइकिलो की मांग और उत्पादन (लाखो में) को दर्शाता है।
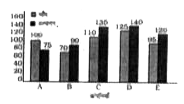
A और D कंपनियों की मोटरसाइकिलो की कुल मांग का कंपनी C की मोटरसाइकिलो के उत्पादन से क्या अनुपात है ?
The correct Answer is:C
Step by step video, text & image solution for दिया गया दंड आरेख (बार ग्राफ) पाँच कंपनियों द्वारा मोटरसाइकिलो की मांग और उत्पादन (लाखो में) को दर्शाता है। A और D कंपनियों की मोटरसाइकिलो की कुल मांग का कंपनी C की मोटरसाइकिलो के उत्पादन से क्या अनुपात है ? by Maths experts to help you in doubts & scoring excellent marks in Class 14 exams.
Updated on:21/07/2023Similar Questions
The given Bar graph presents the Demand and Production of motorcycles of five companies (in lakhs) दिया गया दंड आरेख पांच कंपनियों के संबंध में मोटरसाइकिलों की मांग और उत्पादन ( लाख में ) को दर्शाता है| The company in which the Production of motorcycles is approximately 23% more than the Demand is: वह कंपनी जिसमें मोटरसाइकिलों का उत्पादन, मांग से लगभग 23% अधिक है :
View SolutionThe bar graph given below shows the number of men and women working in the five different companies.
नीचे दिया गया दंड आरेख पाँच विभिन्न कंपनियों में कार्य करने वाले पुरुषों तथा महिलाओं की संख्या को दर्शाता है |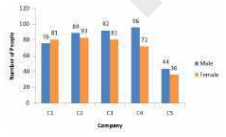 What is the ratio of the total number of men working the companies C2 and C3 to the total number of women working in the companies C1 and C5 ?
C2 तथा C3 कंपनियों में कार्य करने वाले पुरुषों की कुल संख्या C1 तथा C5 तथा कंपनियों में कार्य करने वाली महिलाओं की कुल संख्या का अनुपात कितना है ?
View SolutionThe bar graph given below shows the number of men and women working in the five different companies.
नीचे दिया गया दंड आरेख पाँच विभिन्न कंपनियों में कार्य करने वाले पुरुषों तथा महिलाओं की संख्या को दर्शाता है |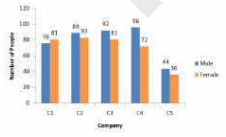 The total number of men working in the five companies is approximately what percent more than that of women working in these companies?
इन पांच कंपनियों में कार्य करने वाले पुरुषों की कुल संख्या, इन पांच कंपनियों में कार्य करने वाली महिलाओं की कुल संख्या से (लगभग) कितना प्रतिशत अधिक है ?
View SolutionThe given bar graph shows the production and sale of mobile handsets of six different companies A, B, C, D, E, & F during the period of one month. With respect to production, the sale percentage of which company is highest ? दंड आरेख विभिन्न कंपनियों A, B, C, D, E & F की एक माह में मोबाइल हैंडसेट के उत्पादन और बिक्री को दर्शाता है | किस कंपनी की बिक्री का प्रतिशत, उसके उत्पादन के संदर्भ में, सबसे अधिक है ?
View SolutionThe given table represents the sale (in thousands) of cars by four companies A,B,C and D in six years. Study the table and answer the questions that follow: दी गयी तालिका चार कंपनियों - A, B, C और D के द्वारा छः वर्षों में की गयी कारों की बिक्री ( हज़ार में ) दर्शाती है | इस तालिका का अध्ययन करें तथा फिर पूछे गए प्रश्नों के उत्तर दें | What is the ratio of total number of cars sold by companies A,B and D in 2017 to the total number of cars sold by all companies in 2018? कंपनी A, B और D के द्वारा 2017 में बेची गयी कारों की कुल संख्या तथा 2018 में सभी कंपनियों के द्वारा बेची गयी कारों की कुल संख्या के बीच क्या अनुपात है ?
View Solutionfirst graph shows the number of students (boys and girls in thousands) in Grade 1 to Grade 5.
पहला आरेख ग्रेड 1 से लेकर ग्रेड 5 तक छात्रों की संख्या (लड़के और लड़कियाँ, हज़ार में) को दर्शाता है।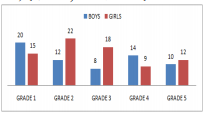 And the bar graph below shows the percentage share of five schools in the total students studying in that class.
और नीचे दिया गया दंड आरेख उस कक्षा में पढ़ रहे कुल छात्रों में पाँच विद्यालयों की प्रतिशत हिस्सेदारी को दर्शाता है।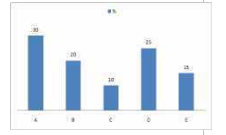 Based on the information, if the boys to girls ratio in school D is 3:1, then the number of boys studying in school D is:
दी गयी जानकारी के आधार पर, यदि विद्यालय D में लड़कों और लड़कियों की संख्या का अनुपात 3:1 है, तो विद्यालय D में पढ़ने वाले लड़कों की | संख्या कितनी है?
View SolutionIn the given bar graph, the Blue bar shows the income and the Red bar shows the expenditure of a company. Study the graph and answer the question that follows
दिए गए दंड आरेख में, नीला दंड एक कंपनी की आय दिखाता है और लाल दंड खर्च (लाख रुपये में) को दर्शाता है। आरेख का अध्ययन करें और उस प्रश्न का उत्तर दें जो नीचे पूछा गया है। The percentage decrease in the income of the company in 2002 as compared to that in 2001 is:
2001 की तुलना में 2002 में कंपनी की आय में कितने प्रतिशत में कमी आई है:
View SolutionThe given Bar Graph presents the Demand and Production of motorcycles of five companies (in lakhs). The Company in which the Production of motorcycles is approximately 23% more than the Demand is: दिया गया दंड आरेख (बार ग्राफ) पांच कंपनियों द्वारा मोटरसाइकिलों की मांग और उत्पादन को (लाखों में) दर्शाता है| वह कंपनी कौन सी है, जिसमें मोटरसाइकिलों का उत्पादन उनकी मांग से लगभग 23% अधिक है:
View Solution
