नीचे दिया गया दंड आरेख एक कम्पनी द्वारा पाँच क्रमागत वर्षो में तीन प्रकार के बिस्कुटों का उत्पादन (हजार बिस्कुटों के यूनिट में ) दर्शाता है।

1994 से 1995 में निर्मित ग्लूकोस बिस्कुटों की संख्या में प्रतिशत गिरावट है
10
15
25
20
The correct Answer is:C
Step by step video, text & image solution for नीचे दिया गया दंड आरेख एक कम्पनी द्वारा पाँच क्रमागत वर्षो में तीन प्रकार के बिस्कुटों का उत्पादन (हजार बिस्कुटों के यूनिट में ) दर्शाता है। 1994 से 1995 में निर्मित ग्लूकोस बिस्कुटों की संख्या में प्रतिशत गिरावट है by Maths experts to help you in doubts & scoring excellent marks in Class 14 exams.
Updated on:21/07/2023Similar Questions
In the given bar graph, the percentage decrease in the number of students in Institute A in 2016 is what percent of students in 2015. इस दंड आरेख में संस्थान A में 2016 में छात्रों की संख्या में प्रतिशत कमी 2015 के छात्रों की संख्या का क्या प्रतिशत है ?
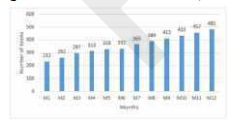
View SolutionThe bar graph given below presents the number of books sold by a bookseller during different months of a year.
नीचे दिया गया दंड आरेख एक पुस्तक विक्रेता के द्वारा किसी वर्ष के अलग-अलग महीनों में बेची गयी पुस्तकों की संख्या को दर्शाता है | What is the total number of books sold by the bookseller in the year?
वर्ष में इस पुस्तक विक्रेता के द्वारा बेची गयी पुस्तकों की संख्या कुल कितनी है ?
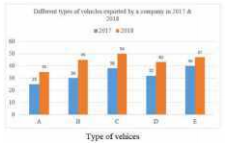
View SolutionThe given Bar Graph presents the number of different types of vehicles exported by a company in 2017 and 2018.The average export of vehicles in 2018 is what percent more than the export of vehicle A in 2017?
दिया गया दंड आरेख एक कंपनी के द्वारा 2017 और 2018 में निर्यात किये गए अलग-अलग प्रकार के वाहनों की संख्या को दर्शाता है |
2018 में वाहनों का औसत निर्यात 2017 में वाहन A के निर्यात से कितना प्रतिशत अधिक है ?
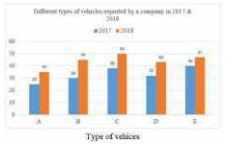
View SolutionThe given Bar Graph presents the number of different types of vehicles exported by a company in 2017 and 2018.The increase in the exports in 2018 as compared to that in 2017 is closest to 32% in case of vehicles of type:
दिया गया दंड आरेख एक कंपनी के द्वारा 2017 और 2018 में निर्यात किये गए अलग-अलग प्रकार के वाहनों की संख्या को दर्शाता है |
किस प्रकार के वाहनों के मामले में 2017 की तुलना में 2018 में निर्यात में हुई वृद्धि 32% के लगभग है :
View SolutionIn the given bar graph, the Blue bar shows the income and the Red bar shows the expenditure of a company. Study the graph and answer the question that follows
दिए गए दंड आरेख में, नीला दंड एक कंपनी की आय दिखाता है और लाल दंड खर्च (लाख रुपये में) को दर्शाता है। आरेख का अध्ययन करें और उस प्रश्न का उत्तर दें जो नीचे पूछा गया है। The percentage decrease in the income of the company in 2002 as compared to that in 2001 is:
2001 की तुलना में 2002 में कंपनी की आय में कितने प्रतिशत में कमी आई है:
View SolutionThe given bar graph shows the number of students of two schools over a period of six years
दिया गया दंड आरेख में छह साल की अवधि में दो स्कूलों के छात्रों की संख्या को दर्शाता है।
In the bar graph, in which year is the sum of the students from schools A and B taken together is minimum ?
दंड आरेख में, A और B स्कूलों के छात्रों का योग किस वर्ष में न्यूनतम है?
View SolutionThe given Bar Graph presents the number of students of two schools for six years. दिया गया दंड आरेख (बार ग्राफ) छह वर्षो के दौरान दो स्कूलों में विद्यार्थियों की संख्या को दर्शाता है| In which year, the percentage increase in students in school B is the highest in comparison to its previous year? किस वर्ष में, स्कूल B के विद्यार्थियों की संख्या में प्रतिशत वृद्धि इसके पिछले वर्ष की तुलना में सबसे अधिक है?
View SolutionThe given Bar Graph presents the number of students of two schools for six years. दिया गया दंड आरेख (बार ग्राफ) छह वर्षो के दौरान दो स्कूलों में विद्यार्थियों की संख्या को दर्शाता है| In which year, percentage increase of students in school A is the highest in comparison to its previous year ? किस वर्ष में, स्कूल A की विद्याथियों की संख्या में प्रतिशत वृद्धि इसके पिछले वर्ष की तुलना में सबसे अधिक है?
View Solution
