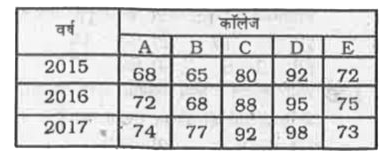
यह तालिका तीन वर्ष के दौरान पाँच अलग - अलग कॉलेजों के उत्तीर्ण विद्यार्थियों के प्रतिशत को दर्शाती है। यह दिया है कि प्रत्येक कॉलेज से हर वर्ष 200 विद्यार्थी परीक्षा में बैठे थे ?

किस कॉलेज में दिए गए तीन वर्षो में छात्रों को उत्तीर्ण करने का औसत प्रतिशत सबसे कम है ?
E
B
F
A
The correct Answer is:B
Step by step video & text solution for यह तालिका तीन वर्ष के दौरान पाँच अलग - अलग कॉलेजों के उत्तीर्ण विद्यार्थियों के प्रतिशत को दर्शाती है। यह दिया है कि प्रत्येक कॉलेज से हर वर्ष 200 विद्यार्थी परीक्षा में बैठे थे ? किस कॉलेज में दिए गए तीन वर्षो में छात्रों को उत्तीर्ण करने का औसत प्रतिशत सबसे कम है ? by Maths experts to help you in doubts & scoring excellent marks in Class 14 exams.
Similar Questions
This table shows the number of students studying in various streams in different colleges. निम्नलिखित तालिका पांच कॉलेजों के तीन विषयों में पढ़ने वाले छात्रों की संख्या दर्शाती है | The number of students in the science stream of college C is approximately what percentage of students studying in that college? कॉलेज C में विज्ञान विषय में छात्रों की संख्या उस कॉलेज में पढ़ने वाले छात्रों की संख्या का लगभग कितना प्रतिशत है ?
02:20View SolutionThe following table shows the percentage distribution of students in various disciplines from five different colleges. निम्नलेखित तालिका पांच अलग-अलग कॉलेजों के विभिन्न विषयों में छात्रों का प्रतिशत वितरण दर्शाती है | If the data of the total students’ college wise, is represented by a pie-chart, what is the central angle of the sector representing college E (to nearest whole number)? यदि कॉलेज वार कुल छात्रों के आंकड़ों को एक पाई-चार्ट में प्रस्तुत किया जाए, तो कॉलेज E को दर्शन वाले खंड का केंद्रीय कोण क्या होगा ? ( निकटतम पूर्ण संख्या में )
02:13View SolutionThis table shows the percentage of students passing out of five different colleges over three years. It is given that from each college, 200 students appeared every year. यह तालिका तीन वर्षों में पांच अलग-अलग कॉलेजों से पास करने वाले छात्रों का प्रतिशत दर्शाती है | यह दिया गया है कि प्रत्येक कॉलेज से हर वर्ष 200 छात्र शामिल हुए | What is the approximate percentage increase in the number of students passing out of college B in the year 2017 as compared to the previous year? कॉलेज B से वर्ष 2017 में पास करने वाले छात्रों की संख्या में पिछले वर्ष की तुलना में लगभग कितने प्रतिशत की वृद्धि हुई है ?
02:21View SolutionThis table shows the percentage of students passing out of five different colleges over three years. It is given that from each college, 200 students appeared every year. यह तालिका तीन वर्षों में पांच अलग-अलग कॉलेजों से पास करने वाले छात्रों का प्रतिशत दर्शाती है | यह दिया गया है कि प्रत्येक कॉलेज से हर वर्ष 200 छात्र शामिल हुए | In which college the average percentage of passing students over the given three years is the least? किस कॉलेज में दिए गए तीन वर्षों के दौरान पास करने वाले छात्रों का औसत प्रतिशत सबसे कम रहा है ?
02:11View SolutionThis table shows the percentage of students passing out of five different colleges over three years. It is given that from each college, 200 students appeared every year. यह तालिका तीन वर्षों में पांच अलग-अलग कॉलेजों से पास करने वाले छात्रों का प्रतिशत दर्शाती है | यह दिया गया है कि प्रत्येक कॉलेज से हर वर्ष 200 छात्र शामिल हुए | What is the ratio of the number of students passing to those failing from college E in the year 2015? वर्ष 2015 में कॉलेज E से पास करने वाले छात्रों की संख्या का फेल करने वाले छात्रों की संख्या के साथ अनुपात ज्ञात करें |
01:48View SolutionThe bar graph given below shows the profit (in multiples of thousand rupees) of a company during the year 2010-2018. The average profit for the year 2015-2017 is what percentage more than the 2012 profit? नीचे दिए गए दंड आरेख में वर्ष 2010-2018 के दौरान किसी कंपनी के लाभ (हजार रुपए के गुणक में) को दर्शाया गया है | वर्ष 2015-2017 का औसत लाभ 2012 के लाभ से कितना प्रतिशत अधिक है ?
01:37View SolutionThe following table shows the number of students enrolled in different faculties in a college.
निम्नलिखित तालिका एक कॉलेज में अलग-अलग विषयों में नामांकित छात्रों की संख्या को दर्शाती है | The percentage of students studying in faculties other than Science is:
विज्ञान के अतिरिक्त अन्य विषयों की पढ़ाई करने वाले छात्रों का प्रतिशत है01:54View SolutionThe given Bar Graph presents the number of students of two schools for six years. दिया गया दंड आरेख (बार ग्राफ) छह वर्षो के दौरान दो स्कूलों में विद्यार्थियों की संख्या को दर्शाता है| In which year, the percentage increase in students in school B is the highest in comparison to its previous year? किस वर्ष में, स्कूल B के विद्यार्थियों की संख्या में प्रतिशत वृद्धि इसके पिछले वर्ष की तुलना में सबसे अधिक है?
03:16View Solution

