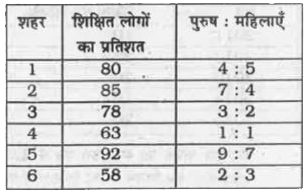
नीचे दी गई तालिका में 6 शहरों में शिक्षित लोगों के प्रतिशत को दर्शाया गया है। यह तालिका शिक्षित लोगों में पुरुषों तथा महिलाओं के अनुपात को भी दर्शाती है।
किसी शहर के शिक्षित लोगों का प्रतिशत = ( उस शहर के शिक्षित लोग/उस शहर की कुल जनसंख्या ) ×100
यदि शहर 4 की कुल जनसंख्या 600000 है, तो शहर 4 में कितने शिक्षित लोग है ?
480000
378000
468000
348000
The correct Answer is:B
Step by step video, text & image solution for नीचे दी गई तालिका में 6 शहरों में शिक्षित लोगों के प्रतिशत को दर्शाया गया है। यह तालिका शिक्षित लोगों में पुरुषों तथा महिलाओं के अनुपात को भी दर्शाती है। किसी शहर के शिक्षित लोगों का प्रतिशत = ( उस शहर के शिक्षित लोग/उस शहर की कुल जनसंख्या ) xx 100 यदि शहर 4 की कुल जनसंख्या 600000 है, तो शहर 4 में कितने शिक्षित लोग है ? by Maths experts to help you in doubts & scoring excellent marks in Class 14 exams.
Similar Questions
'मेरा घर इसी शहर में है' में कौन-सा विशेषण है?
01:13View SolutionThe population of a town has increased by 5% at the end of the first year and decreased by 4% at the end of second year. If the population at the end of second year was 55,12,248, then the population at the beginning of first year was:
एक शहर की आबादी पहले वर्ष के अंत में 5% बढ़ी है और दूसरे वर्ष के अंत में 4% कम हुई। यदि दूसरे वर्ष के अंत में जनसंख्या 55,12,248 थी, तो पहले वर्ष की शुरुआत में जनसंख्या थी:02:08View SolutionThe table below indicates the percentage of students and the ratio of boys and girls in the various streams of a college. (Total students = 2600) नीचे दी गयी तालिका छात्रों का प्रतिशत तथा कॉलेज के विभिन्न विषयों में लड़कों तथा लड़कियों का अनुपात दर्शाती है | ( कुल छात्र = 2600 ) In which stream, is the difference in the percentage of boys and girls minimum? किस विषय में, लड़कों एवं लड़कियों के प्रतिशत में सबसे कम अंतर है ?
02:23View SolutionThe table shows Income and expenditure of a person for 3 years (in thousands)
यह तालिका 3 वर्षों के दौरान किसी व्यक्ति के आय एवं व्यय (हज़ार में ) को दर्शाती है |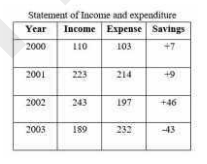 In the given table, if a person reduced his expenditure by 10% by how much would his total
savings increased?
दी गयी तालिका के अनुसार यदि व्यक्ति अपने व्यय में 10% की कमी कर ले, तो उसकी बचत में कुल कितनी वृद्धि होगी ?01:43View SolutionThe Table given below presents the Rainfall (in mm) in two cities on different days of a week.
नीचे दी गयी तालिका दो शहरों में सप्ताह के अलग-अलग दिन हुई बारिश (मिमी में ) को दर्शाती है |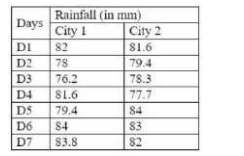 The rainfall on day D2 in city 1 is how much percent more than the rainfall on day D4 in city 2?
D2 दिन को शहर 1 में हुई बारिश D4 दिन को शहर 2 में हुई बारिश से कितनी प्रतिशत अधिक है ?02:55View SolutionThe Table given below presents the Rainfall (in mm) in two cities on different days of a week.
नीचे दी गयी तालिका दो शहरों में सप्ताह के अलग-अलग दिन हुई बारिश (मिमी में ) को दर्शाती है |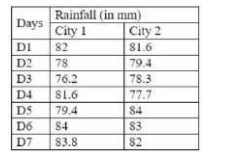 If the data of Rainfall of City 1 is represented through a Pie chart, then what will be the central
angle (nearest to 0.1 degree) corresponding to D1?
यदि शहर 1 की वर्षा के आंकड़ों को एक पाई-चार्ट में प्रस्तुत किया जाए, तो D1 के संगत केंद्रीय कोण ( 0.1 डिग्री के निकटतम ) का मान क्या होगा ?03:37View SolutionThe following table showing the percentage of the total population of a state in different age groups. Out of every 50,000 people, find the approximate number of persons below the age of 35?
निम्नलिखित तालिका एक राज्य में अलग-अलग आयु वर्ग की कुल आबादी के प्रतिशत को दर्शाती है |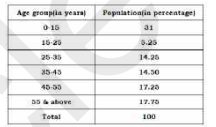
प्रत्येक 50,000 लोगों में से, 35 वर्ष से कम उम्र के लोगों की संख्या (लगभग) ज्ञात करें |02:27View SolutionThe following graph shows the sales of cars (in thousands) in four cities in 4 years. Study the graph and answer the questions.
निम्नलिखित आरेख 4 वर्षों में चार शहरों में कारों की बिक्री (हज़ार में) को दर्शाता है। इस आरेख का अध्ययन कीजिए तथा प्रश्नों के उत्तर दीजिए। Which city has the highest percentage of sales, and in which year?
किस शहर की बिक्री का प्रतिशत सबसे अधिक है तथा किस वर्ष में?03:44View Solution

