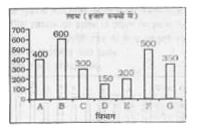
यह दण्ड आरेख एक कंपनी के विभिन्न के मासिक लाभ को दर्शाता है।

अगर कंपनी में केवल 7 विभाग है तो कंपनी की मासिक आय (लाख रुपए में ) क्या है, यदि मासिक लाभ कंपनी के कुल मासिक राजस्व का 20% था ?
1250
500
50
125
The correct Answer is:D
Step by step video, text & image solution for यह दण्ड आरेख एक कंपनी के विभिन्न के मासिक लाभ को दर्शाता है। अगर कंपनी में केवल 7 विभाग है तो कंपनी की मासिक आय (लाख रुपए में ) क्या है, यदि मासिक लाभ कंपनी के कुल मासिक राजस्व का 20% था ? by Maths experts to help you in doubts & scoring excellent marks in Class 14 exams.
Updated on:21/07/2023Similar Questions
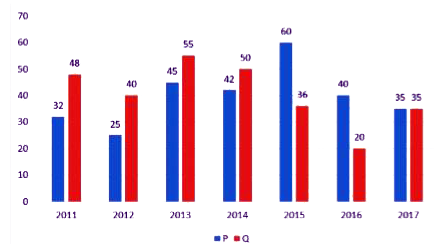
The Bar Graph shows the Profit (Rupees in Lakhs) earned by two companies P and Q during the period 2011 to 2017.
यह दंड आरेख दो कंपनियों P एवं Q के द्वारा 2011 से 2017 की अवधि में कमाए गए लाभ ( लाख रुपये में ) को दर्शाता है | The ratio of profit during the given period for Company P to Company Q is:
दी गयी अवधि के दौरान कंपनी P और कंपनी Q के लाभ में क्या अनुपात है ?
View SolutionThe pie-chart specifically shows the allocation of revenue for the expenses of a company. If the sales of the company are Rs.4000000 and 75% of the revenue is allocated for expenses, then what is the total amount spent on wages and deliverables? वृत्त आरेख में विशेष रूप से किसी कंपनी के खर्चों के लिए राजस्व के आबंटन को दर्शाया गया है | यदि कंपनी की बिक्री रु 4000000 है और राजस्व का 75% खर्चों के लिए आवंटित किया जाता है, तो मजदूरी और प्रदेय (डिलीवरी) पर खर्च की गयी कुल राशि कितनी है ?
View SolutionThe bar graph given below shows the profit (in multiples of thousand rupees) of a company during the year 2010-2018. The average profit for the year 2015-2017 is what percentage more than the 2012 profit? नीचे दिए गए दंड आरेख में वर्ष 2010-2018 के दौरान किसी कंपनी के लाभ (हजार रुपए के गुणक में) को दर्शाया गया है | वर्ष 2015-2017 का औसत लाभ 2012 के लाभ से कितना प्रतिशत अधिक है ?
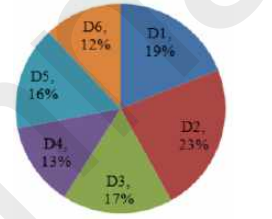
View SolutionThe pie-chart given below shows the expenses incurred by various departments of a company. Each expense is shown as a percentage of the company.s total expenditure. The central angles shown in the pie-chart are not according to any selected scale.
नीचे दिया गया वृत्त आरेख किसी कंपनी के विभिन्न विभागों द्वारा किए खर्चों को दर्शाता है | प्रत्येक खर्च को कंपनी के कुल व्यय के प्रतिशत के रूप में दर्शाया गया है | वृत्त आरेख में दर्शाए गए केंद्रीय कोण किसी चयनित पैमाने के अनुसार नहीं हैं | If the total expenses of the company is 20 lacs, then find the total expenses incurred on the
departments D2, D4 and D5.
यदि कंपनी के कुल खर्चे रु 20 लाख हैं, तो D2, D4 तथा D5 विभागों पर किया गया कुल खर्चा कितना है ?
View SolutionThe given Bar Graph presents Income and Expenditure (in crores of Rupees) of a company for five years, 2014 to 2018. What is the ratio of total Expenditure to total Income of the company in 2014,2016 and 2017? दिया गया दंड आरेख (बार ग्राफ) 5 वर्षों, 2014 से 2018 के दौरान किसी कंपनी की आय और व्यय (करोड़ रुपए में) को दर्शाता है| 2014, 2016 और 2017 में कंपनी के कुल व्यय और कुल आय का अनुपात क्या है?
View SolutionThe given Bar Graph presents the Revenue of Expenditure (in crores of rupees) of a company during the five year period, 2014 - 2018. दिया गया दंड आरेख (Bar graph) 5 वर्ष की अवधि 2014-2018 के दौरान किसी कंपनी के राजस्व और व्यय (करोड़ रुपए में) को दर्शाता है| वर्ष 2016 से 2018 तक कंपनी का कुल व्यय, 5 वर्ष की अवधि के कुल राजस्व का कितना प्रतिशत )पूर्णांक के करीब है)? The total expenditure of the company from 2016 - 2018 is what percentage (nearest to an integer) of the total revenue of the five year period?
View Solution3 friends A, B and C are working in a company. The salary of A is Rs45,000 per month. C's monthly salary is 3/5th of B's monthly salary. B's monthly salary is double of A's monthly salary. What is the total salary of A, B and C per month?
तीन दोस्त A, B, C एक कंपनी में कार्यरतत है| A हर महीने 45000 रुपय कमाता है| C की मासिकआय B की आय के 3/5 है| B की मासिक आय की A आय की दोगुना है | A, B, C की कुल मासिक आय कितनी है ?
View SolutionStudy the following graph which shows income and expenditure of a company over the years and answer the questions. The difference in profit (in crores) of the company during 2007 and 2008 is. निम्नलिखित चार्ट का अध्ययन कीजिए जिसमें कंपनी की कुछ वर्षों की आय एवं उसके व्यय को दर्शाया गया है और प्रश्नों के उत्तर दीजिए : वर्ष 2007 और 2008 में कंपनी के लाभ में अंतर (₹ करोड़ में) कितना है?
View Solution
