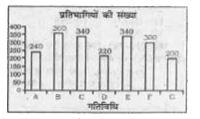
यह दंड आरेख दर्शाता है कि एक एडवेंचर रिसोर्ट में अपने निवास के दौरान कितने यात्रियों ने किन-किन एडवेंचर गतिविधियों में भाग लिया था।

गतिविधि A के प्रतिभागी गतिविधि F के प्रतिभागियों की तुलना में ____ प्रतिशत कम थे।
25
30
20
35
The correct Answer is:C
Step by step video, text & image solution for यह दंड आरेख दर्शाता है कि एक एडवेंचर रिसोर्ट में अपने निवास के दौरान कितने यात्रियों ने किन-किन एडवेंचर गतिविधियों में भाग लिया था। गतिविधि A के प्रतिभागी गतिविधि F के प्रतिभागियों की तुलना में ____ प्रतिशत कम थे। by Maths experts to help you in doubts & scoring excellent marks in Class 14 exams.
Updated on:21/07/2023Similar Questions
The inequation that best describes the graph given below is _________
View SolutionThe inequation that best describes the following graph is _________
View SolutionWhich inequations represent the shaded region in the given figure
View SolutionThe bar graph given below shows the wheat production (in tonnes) of a large farm during the year 2011-2018. In how many years was wheat production higher than the average production of the period? नीचे दिए गए दंड आरेख में वर्ष 2011-2018 के दौरान किसी बड़े फार्म के गेहूं उत्पादन (टन में) को दर्शाया गया है | अवधि के औसत उत्पादन की तुलना में दिए गए कितने वर्षो में गेहूं उत्पादन अधिक था ?
View SolutionThe given Bar Graph presents the number of students of two schools for six years. दिया गया दंड आरेख (बार ग्राफ) छह वर्षो के दौरान दो स्कूलों में विद्यार्थियों की संख्या को दर्शाता है| In which year, the percentage increase in students in school B is the highest in comparison to its previous year? किस वर्ष में, स्कूल B के विद्यार्थियों की संख्या में प्रतिशत वृद्धि इसके पिछले वर्ष की तुलना में सबसे अधिक है?
View Solution'A' is the portion of adenophypophysis which secrets different hormones 'A' is____
View SolutionIdentify A,B,C and D,E
View SolutionConsider the following reactions.
View Solution
