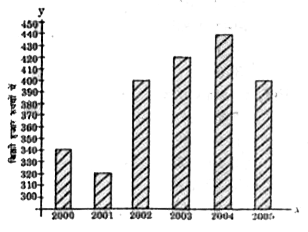
निम्न दंड आरेख एक कंपनी की 2000 से 2005 तक बिक्री का विश्लेषण करता हैं।

2003 में बिक्री की राशि 2001 में बिक्री की राशि से कितनी अधिक हैं ?
Rs. एक सौ
Rs. दस हजार
Rs. एक लाख
Rs. दस लाख
The correct Answer is:C
Step by step video, text & image solution for निम्न दंड आरेख एक कंपनी की 2000 से 2005 तक बिक्री का विश्लेषण करता हैं। 2003 में बिक्री की राशि 2001 में बिक्री की राशि से कितनी अधिक हैं ? by Maths experts to help you in doubts & scoring excellent marks in Class 14 exams.
Updated on:21/07/2023Similar Questions
विद्यालय की कलावीथि में कुछ चित्र (पेंटिंग्स) बिक्री के लिए उपलब्ध हैं। इसके लिए एक विज्ञापन लगभग 50 शब्दों में लिखिए।
View Solutionअपनी पुरानी साइकिल की बिक्री के लिए 50 शब्दों में एक आकर्षक विज्ञापन तैयार कीजिए।
View SolutionThe following line diagram represents the yearly sales figure of a company in the years 2001-2010. Examine the diagram and answer the question. निम्नलिखित रेखा आरेख किसी कंपनी की वर्ष 2007-2010 के दौरान वार्षिक बिक्री के आंकड़ों को दर्शाता है। आरेख का अध्ययन करें और नीचे दिए गए प्रश्नों के उत्तर दें- The ratio of sales in 2002 to that in 2007 is वर्ष 2002 में बिक्री का वर्ष 2007 में बिक्री के साथ अनुपात है-
View SolutionThe following line diagram represents the yearly sales figure of a company in the years 2001-2010. Examine the diagram and answer the question. निम्नलिखित रेखा आरेख किसी कंपनी की वर्ष 2007-2010 के दौरान वार्षिक बिक्री के आंकड़ों को दर्शाता है। आरेख का अध्ययन करें और नीचे दिए गए प्रश्नों के उत्तर दें- ............................................................................................................................................. Total sales (in crore of Rs.) from 2005 to 2008 is वर्ष 2005 से वर्ष 2008 तक कुल बिक्री (रु. करोड में) है-
View SolutionA marketing agent earns a commission of 2% on first Rs. 2,00,000, 1.5% on next Rs 2,00,000 and 1% on the remaining amount of sales made in a month. If the sales achieved by the agent for the month of April 2018 are Rs. 5,68,000. The commission earned is
किसी विपणन एजेंट को एक माह में पहले 2,00,000 रुपये की बिक्री पर 2%, अगले 200000 रुपये की बिक्री पर 1.5% तथा बिक्री की शेष राशि पर 1% कमीशन मिलता है | यदि अप्रैल 2018 माह में उस एजेंट ने 5,68,000 रुपये की बिक्री की है, तो उसके द्वारा प्राप्त कमीशन ज्ञात करें |
View SolutionThe given bar chart shows the details of cycle sales by a company between January and May for years 2017 and 2018.
दिया गया दंड आरेख वर्ष 2017 एवं 2018 में एक कंपनी के द्वारा जनवरी से लेकर मई तक साइकिल बिक्री की जानकारी देता है | In the given bar-chart, which month sales show the maximum decrease in 2018 as compared to 2017?
दिए गए दंड आरेख में, किस माह की बिक्री 2017 की तुलना में 2018 में अधिकतम कमी को दर्शाती है ?
View SolutionThe given bar chart shows the details of cycle sales by a company between January and May for years 2017 and 2018.
दिया गया दंड आरेख वर्ष 2017 एवं 2018 में एक कंपनी के द्वारा जनवरी से लेकर मई तक साइकिल बिक्री की जानकारी देता है | In the given bar-chart, which month sale shows the maximum increase in 2018 as against 2017?
/ दिए गए दंड आरेख के नुसार किस महीने की बिक्री 2017 की तुलना में 2018 में अधिकतम वृद्धि दर्शाती है ?
View SolutionThe given Bar Graph presents the sales of the number of books (in thousands) by six benches of a publishing company during two consecutive years 2000 and 2001. दिया गया दंड आरेख लगातार दो वर्षों : 2000 और 2001 में एक प्रकाशन कंपनी की छः शाखाओं के द्वारा बेची गयी पुस्तकों की संख्या ( हज़ार में ) दर्शाता है | The ratio of total sales by all branches for the year 2001 to total sales by all branches for the year 2000 is: वर्ष 2001 में सभी शाखाओं की कुल बिक्री का वर्ष 2000 में सभी शाखाओं की कुल बिक्री के साथ अनुपात ज्ञात करें|
View Solution
