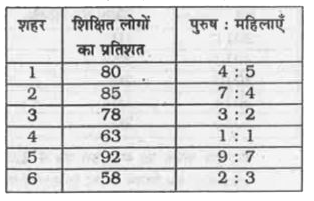
नीचे दी गई तालिका में 6 शहरों में शिक्षित लोगों के प्रतिशत को दर्शाया गया है। यह तालिका शिक्षित लोगों में पुरुषों तथा महिलाओं के अनुपात को भी दर्शाती है।
किसी शहर के शिक्षित लोगों का प्रतिशत = ( उस शहर के शिक्षित लोग/उस शहर की कुल जनसंख्या ) ×100
6 शहरों की जनसंख्या क्रमश: 250000,200000,220000,300000,150000 तथा 400000 है। इन शहरों में शिक्षित लोगों की संख्या का सही क्रम कौन सा है ?
348:595
255:199
595:348
199:255
The correct Answer is:C
Step by step video, text & image solution for नीचे दी गई तालिका में 6 शहरों में शिक्षित लोगों के प्रतिशत को दर्शाया गया है। यह तालिका शिक्षित लोगों में पुरुषों तथा महिलाओं के अनुपात को भी दर्शाती है। किसी शहर के शिक्षित लोगों का प्रतिशत = ( उस शहर के शिक्षित लोग/उस शहर की कुल जनसंख्या ) xx 100 6 शहरों की जनसंख्या क्रमश: 250000, 200000, 220000, 300000, 150000 तथा 400000 है। इन शहरों में शिक्षित लोगों की संख्या का सही क्रम कौन सा है ? by Maths experts to help you in doubts & scoring excellent marks in Class 14 exams.
Updated on:21/07/2023Similar Questions
The given table shows the number (in percent) of employees working in different depratments of an organization. The table also shows the ratio of males and females and the ratio of employees living in city Z and employees , living in city Y. The total number of employees in the organization 80,000.
दी गई तालिका में एक संगठन के विभिन्न विभागों में कार्य कर रहे कर्मचारियों की संख्या ( प्रतिशत में ) को दर्शाया गया है। यह तालिका पुरूषों तथा महिलाओं के अनुपाव को तथा शहर ,Z में रह रहे कर्मचारियों तथा शहर Y में रह रहे कर्मचारियों के अनुपात को भी दर्शाती है। संगठन रद में कुल कर्मचारियों की संख्या 80000 है।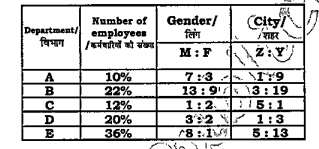 what are the total number of employee in department A and E together?
विभाग A तथा E में मिलाकर कुल कर्मचारियों की संख्या क्या है?
View SolutionThe population of a town is 3,11,250. The ratio between women and men is 43 : 40. If there are 24% literate among men and 8% literate among women, the total number of literate persons in the town is:- एक नगर को जनसंख्या 3,11,250 है। औरत तथा पुरूषों के बीच का अनुपात 43 :40 है। यदि पुरूषों में 24% शिक्षित है तथा औरतों में 8% शिक्षित है, तो नगर में कुल शिक्षित व्यक्तियों की संख्या कितनी है।
View SolutionThe table below indicates the percentage of students and the ratio of boys and girls in the various streams of a college. (Total students = 2600) नीचे दी गयी तालिका छात्रों का प्रतिशत तथा कॉलेज के विभिन्न विषयों में लड़कों तथा लड़कियों का अनुपात दर्शाती है | ( कुल छात्र = 2600 ) In which stream, is the difference in the percentage of boys and girls minimum? किस विषय में, लड़कों एवं लड़कियों के प्रतिशत में सबसे कम अंतर है ?
View SolutionThe table shows the production of different types of cars (in thousands).
यह तालिका एक कंपनी द्वारा अलग-अलग कारों के उत्पादन (हज़ार में ) को दर्शाती है |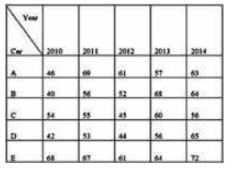 The total production of type A cars in 2011, and type C cars and type E cars in 2012 taken together
is what percent of the total production of type B cars during 2010 to 2014?
2011 में A प्रकार की कारों तथा 2012 में C प्रकार एवं E प्रकार की कारों का कुल उत्पादन ( सब को मिलाकर ) 2010 से 2014 के दौरान B प्रकार की कारों के कुल उत्पादन का कितना प्रतिशत है ?
View SolutionThe Table given below presents the Rainfall (in mm) in two cities on different days of a week.
नीचे दी गयी तालिका दो शहरों में सप्ताह के अलग-अलग दिन हुई बारिश (मिमी में ) को दर्शाती है |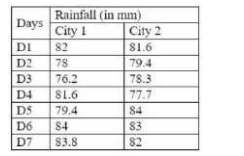 The rainfall on day D2 in city 1 is how much percent more than the rainfall on day D4 in city 2?
D2 दिन को शहर 1 में हुई बारिश D4 दिन को शहर 2 में हुई बारिश से कितनी प्रतिशत अधिक है ?
View SolutionThe Table given below presents the Rainfall (in mm) in two cities on different days of a week.
नीचे दी गयी तालिका दो शहरों में सप्ताह के अलग-अलग दिन हुई बारिश (मिमी में ) को दर्शाती है |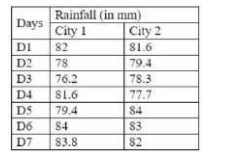 If the data of Rainfall of City 1 is represented through a Pie chart, then what will be the central
angle (nearest to 0.1 degree) corresponding to D1?
यदि शहर 1 की वर्षा के आंकड़ों को एक पाई-चार्ट में प्रस्तुत किया जाए, तो D1 के संगत केंद्रीय कोण ( 0.1 डिग्री के निकटतम ) का मान क्या होगा ?
View SolutionThe given table represents the production of different types of motorcycles (in thousands) over a period of six years. Study the table carefully and answer the questions that follows: दी गयी तालिका छः वर्षों की अवधि के दौरान अलग-अलग प्रकार की मोटर साइकिलों के उत्पादन ( हज़ार में ) को दर्शाती है | इस तालिका का ध्यानपूर्वक अध्ययन करें तथा फिर पूछे गए प्रश्नों का उत्तर दीजिए | What is the percentage increase in the total production of all types of motorcycles from 2014to 2018? 2014 से 2018 तक सभी प्रकार की मोटरसाइकिल के कुल उत्पादन में कितने प्रतिशत की वृद्धि हुई है ?
View SolutionThe following table showing the percentage of the total population of a state in different age groups. Out of every 50,000 people, find the approximate number of persons below the age of 35?
निम्नलिखित तालिका एक राज्य में अलग-अलग आयु वर्ग की कुल आबादी के प्रतिशत को दर्शाती है |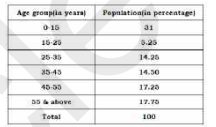
प्रत्येक 50,000 लोगों में से, 35 वर्ष से कम उम्र के लोगों की संख्या (लगभग) ज्ञात करें |
View Solution
