In a particular section of Class IX, 40 students were asked about the months of their birth and the following graph was prepared for the data so obtained:
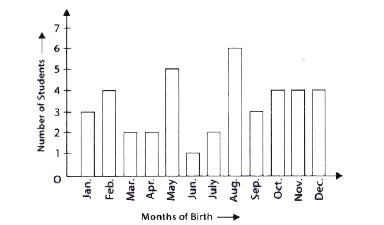
Observe the bar graph given above and answer the following question: Find the probability that a student of the class was born in August.
The correct Answer is:320
Step by step video, text & image solution for In a particular section of Class IX, 40 students were asked about the months of their birth and the following graph was prepared for the data so obtained: Observe the bar graph given above and answer the following question: Find the probability that a student of the class was born in August. by Maths experts to help you in doubts & scoring excellent marks in Class 9 exams.
Updated on:21/07/2023Topper's Solved these Questions
- PROBABILITYBOOK - MTG IIT JEE FOUNDATIONCHAPTER - PROBABILITYEXERCISE - EXERCISE (MULTIPLE CHOICE QUESTIONS)
52 Videos
- PROBABILITYBOOK - MTG IIT JEE FOUNDATIONCHAPTER - PROBABILITYEXERCISE - EXERCISE (MATCH THE FOLLOWING)
1 Videos
- PROBABILITYBOOK - MTG IIT JEE FOUNDATIONCHAPTER - PROBABILITYEXERCISE - SOLVED EXAMPLES
30 Videos
- POLYNOMIALSBOOK - MTG IIT JEE FOUNDATIONCHAPTER - POLYNOMIALSEXERCISE - Olympiad/HOTS Corner
20 Videos
- QUADRILATERALS BOOK - MTG IIT JEE FOUNDATIONCHAPTER - QUADRILATERALS EXERCISE - Olympiad/HOTS CORNER
15 Videos
Similar Questions
In a particular section of Class IX,40 students were asked about the months of their birth and the following graph was prepared for the data so obtained:Observe the bar graph given above and answer the following questions:
(i) How many students were born in the month of November? (ii) In which month were the maximum number of students born?
View SolutionRefer to Example 5, Section 14.4, Chapter 14. Find the probability that a student of the class was born in August.
View Solution
Knowledge Check
In a particular section of class IX, 40 students were asked about the month of their birth and the following graph was prepared for the data so obtained.
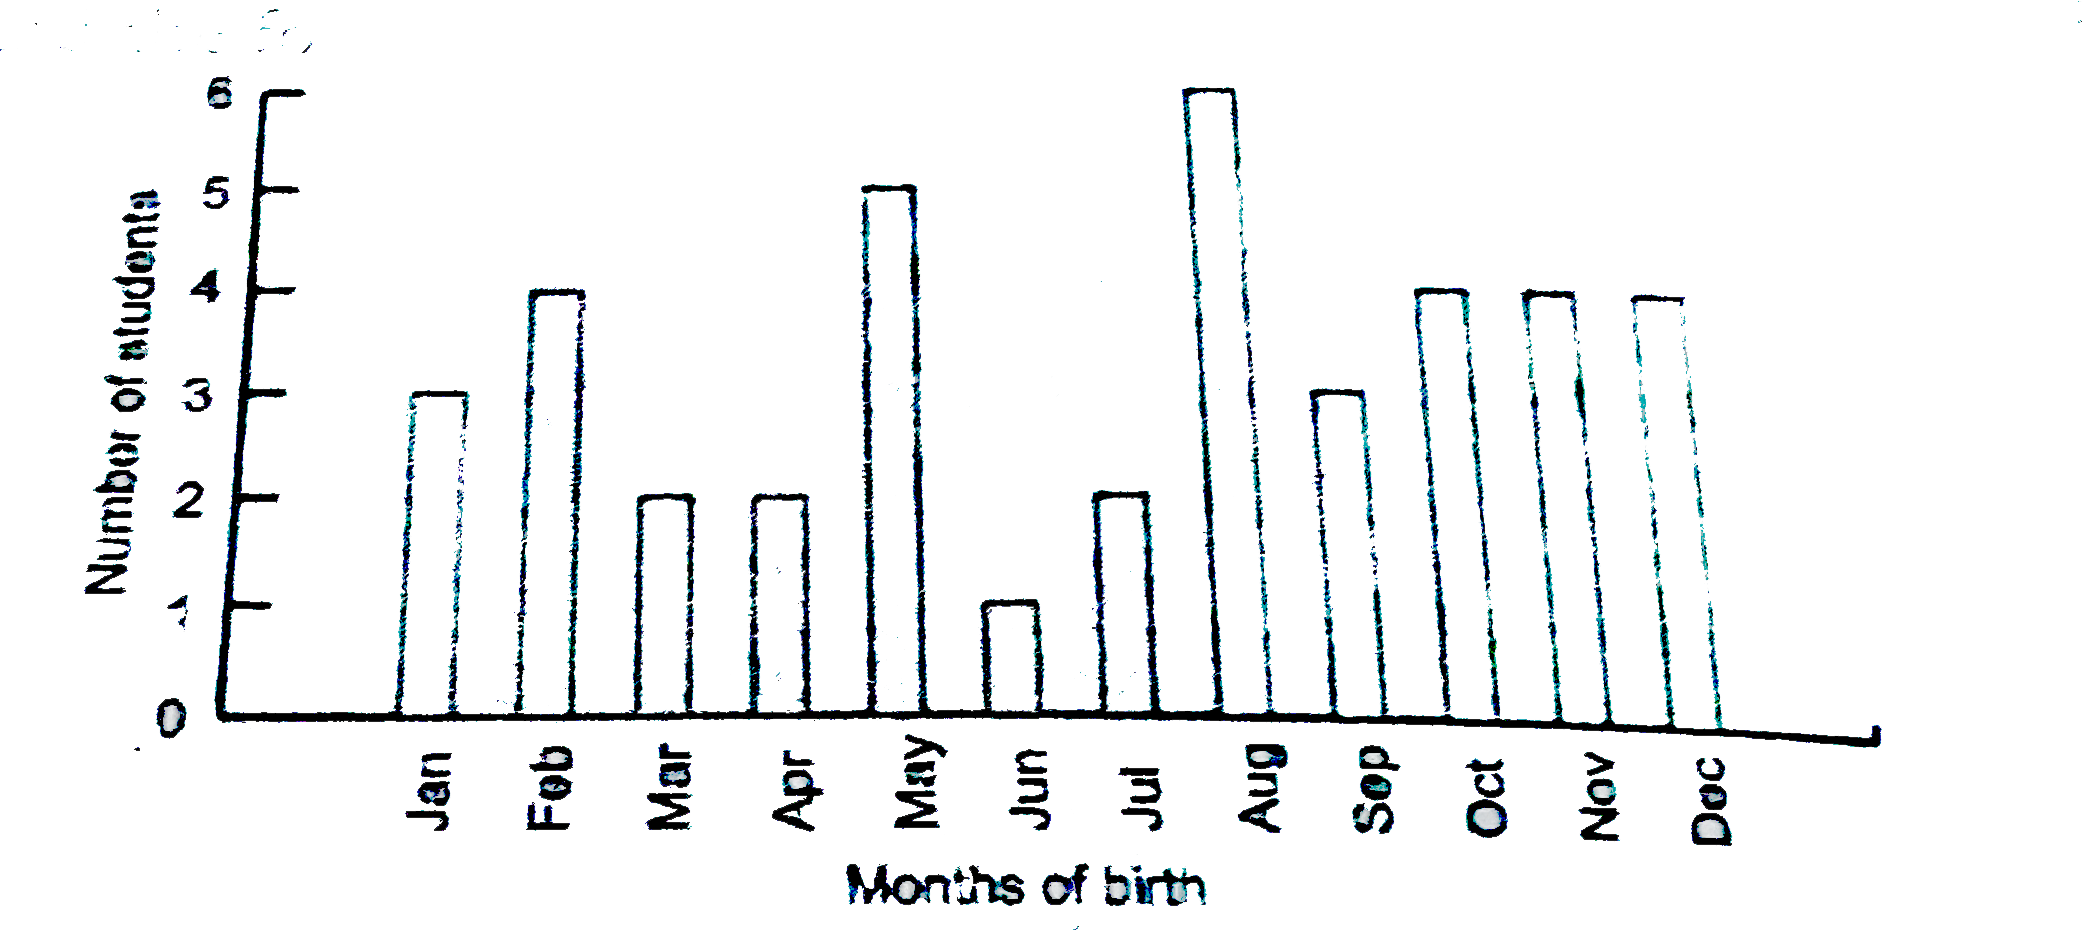
Find the probability that a student of the class was born in August.A12B13C14D320
Read the bar graph given below and answer the following questions:

In which year is the number of students maximum?
View SolutionRead the bar graph given below and answer the following questions:
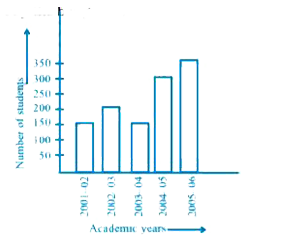
In which year is the number of students twice as that of 2001-02?
View SolutionRead the bar graph given below and answer the following questions:
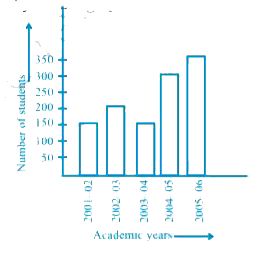
In which year did the number of students decrease as compared to previous year?
View SolutionAnswer the following questions
Find the ratio of students of class sixth to the students of class eight
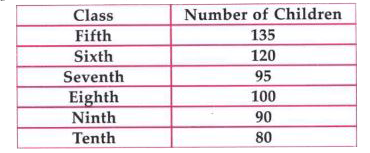
View SolutionLook at the bar graph and answer the following questions.
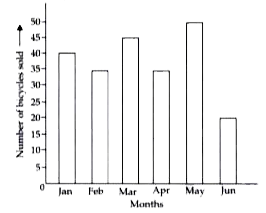
In which month 40 bicycles were sold?
View SolutionRead the bar graph shown in figure and answer the following questions.
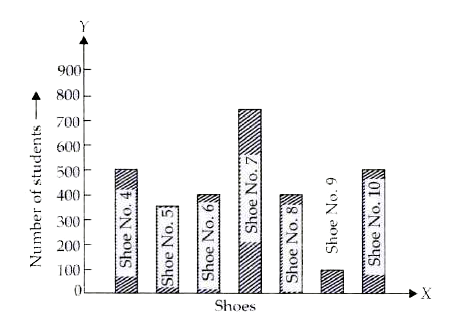
What are the different numbers of the shoesworn by the students?
View SolutionRead the bar graph carefully and answer the following questions.
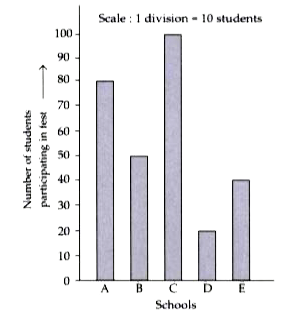 How may students of school B participated in the fest ?
View Solution
