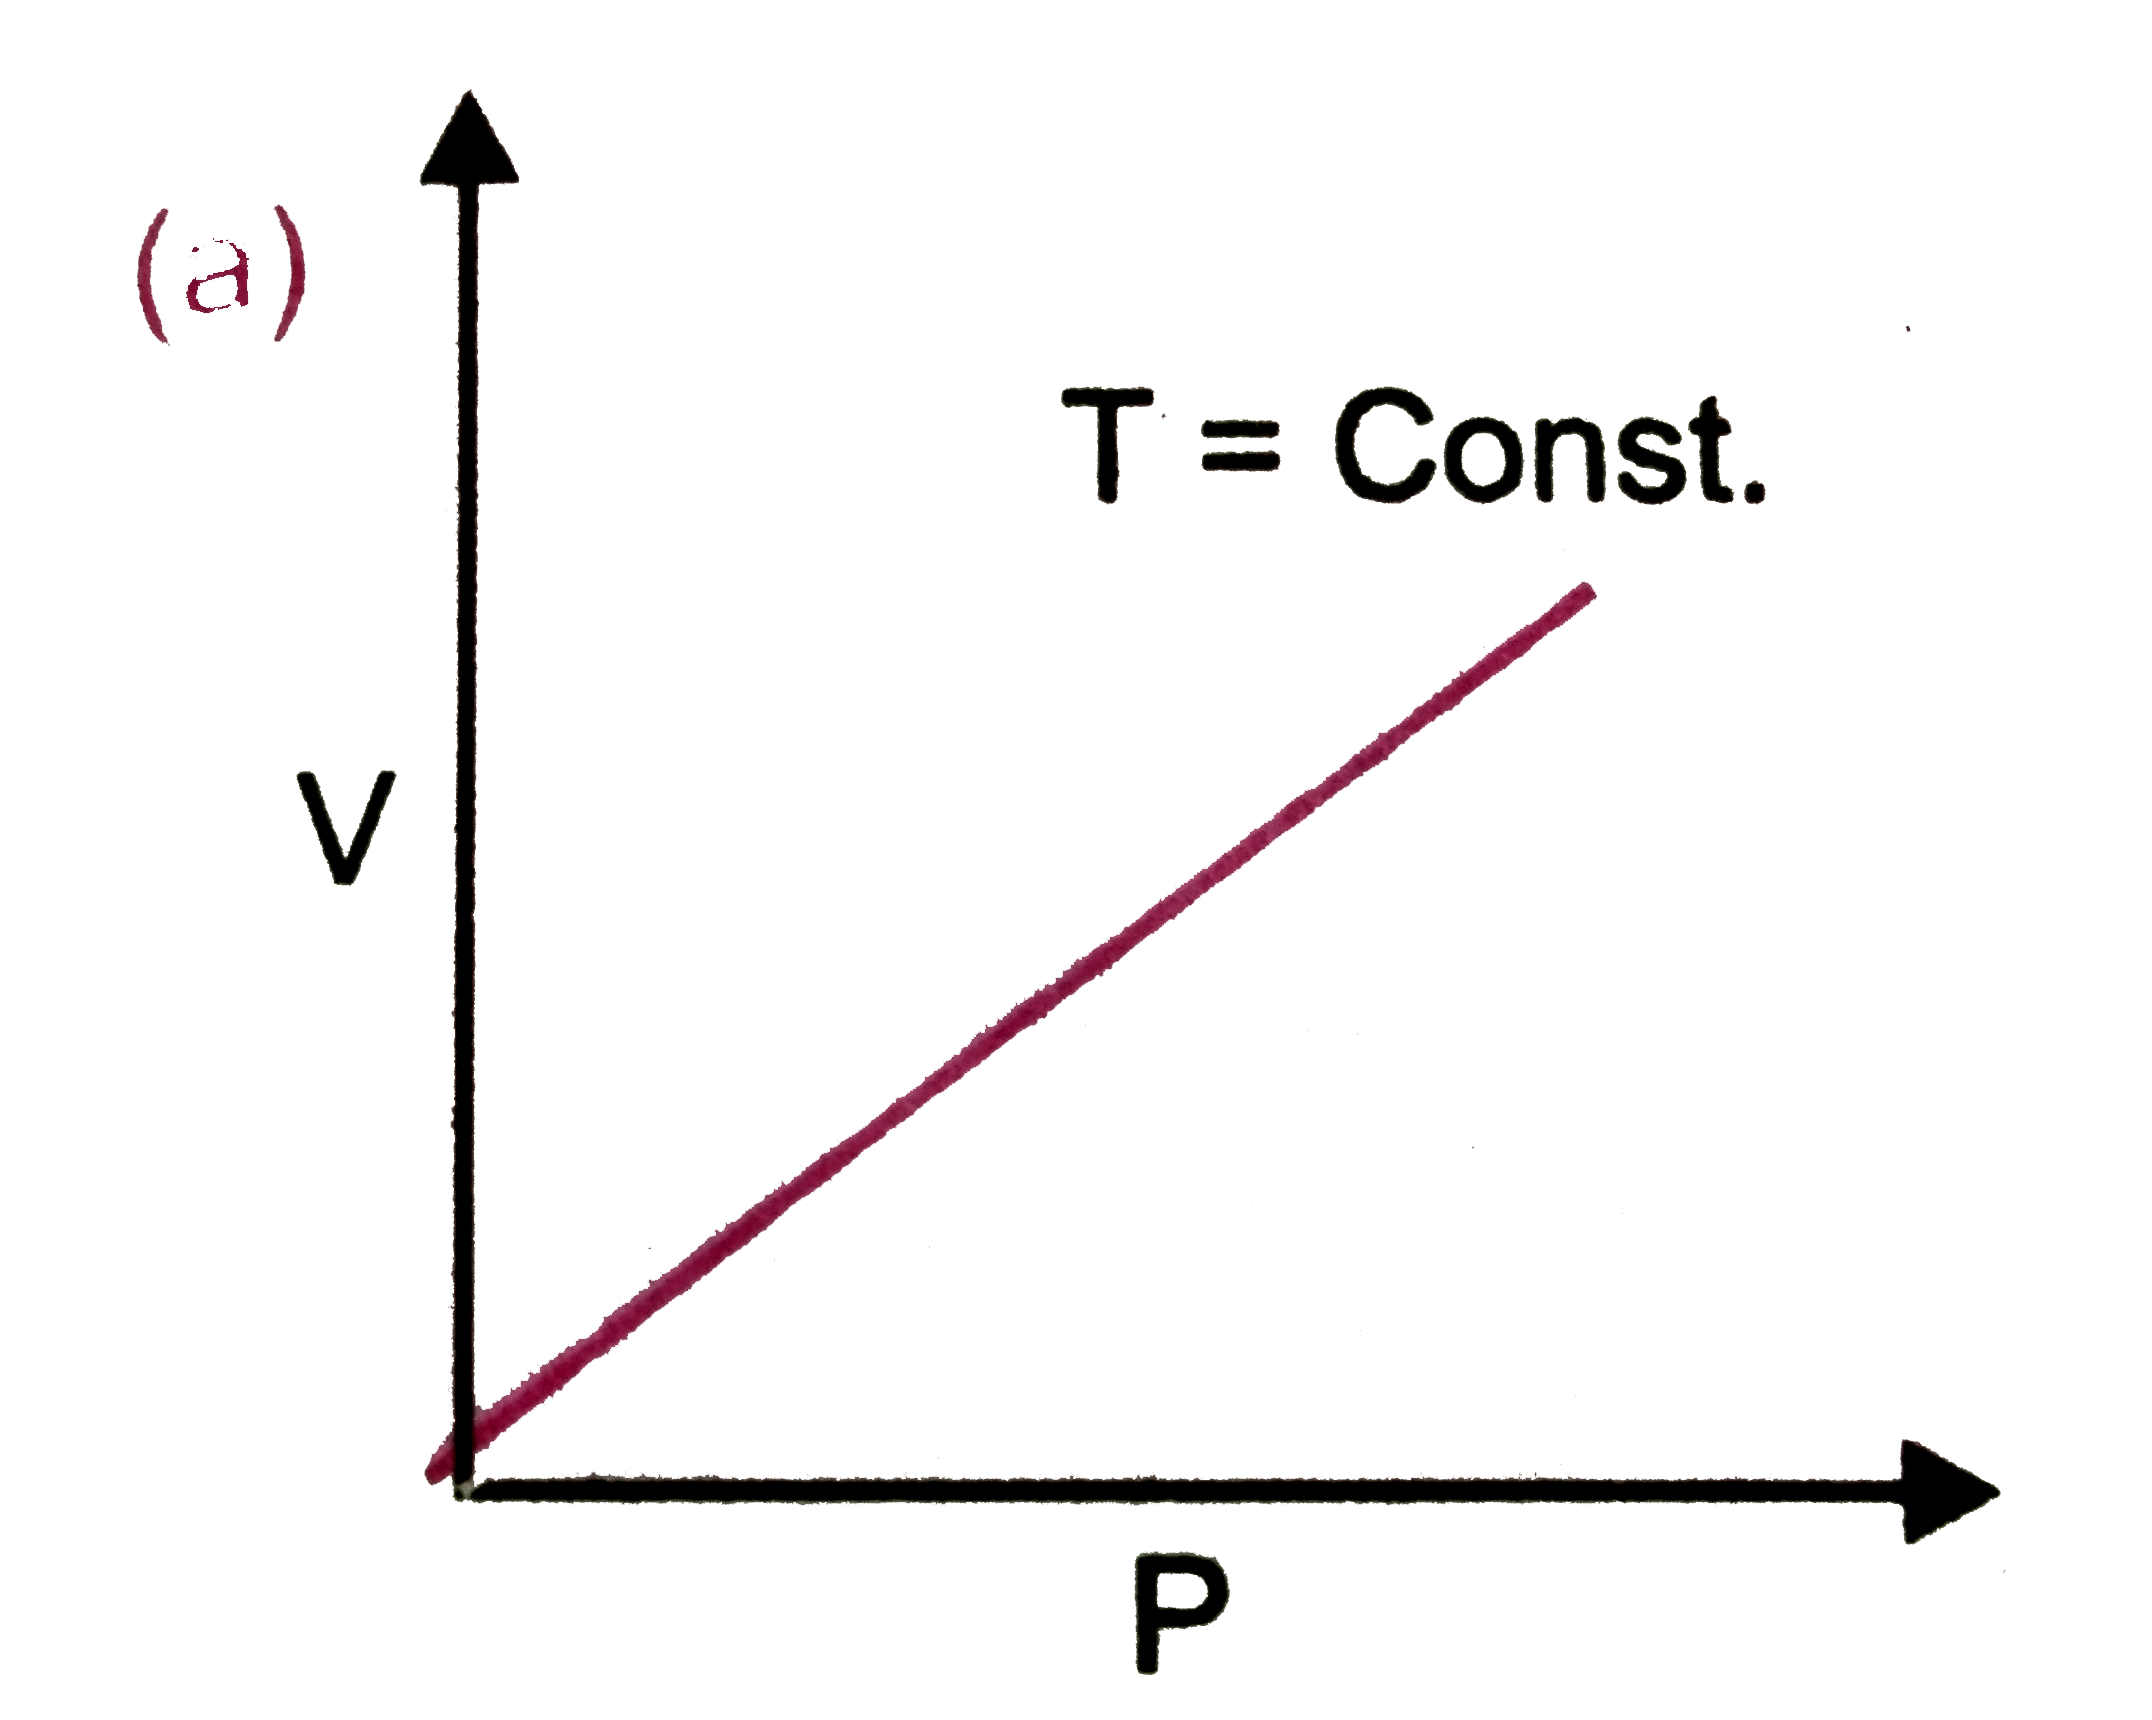
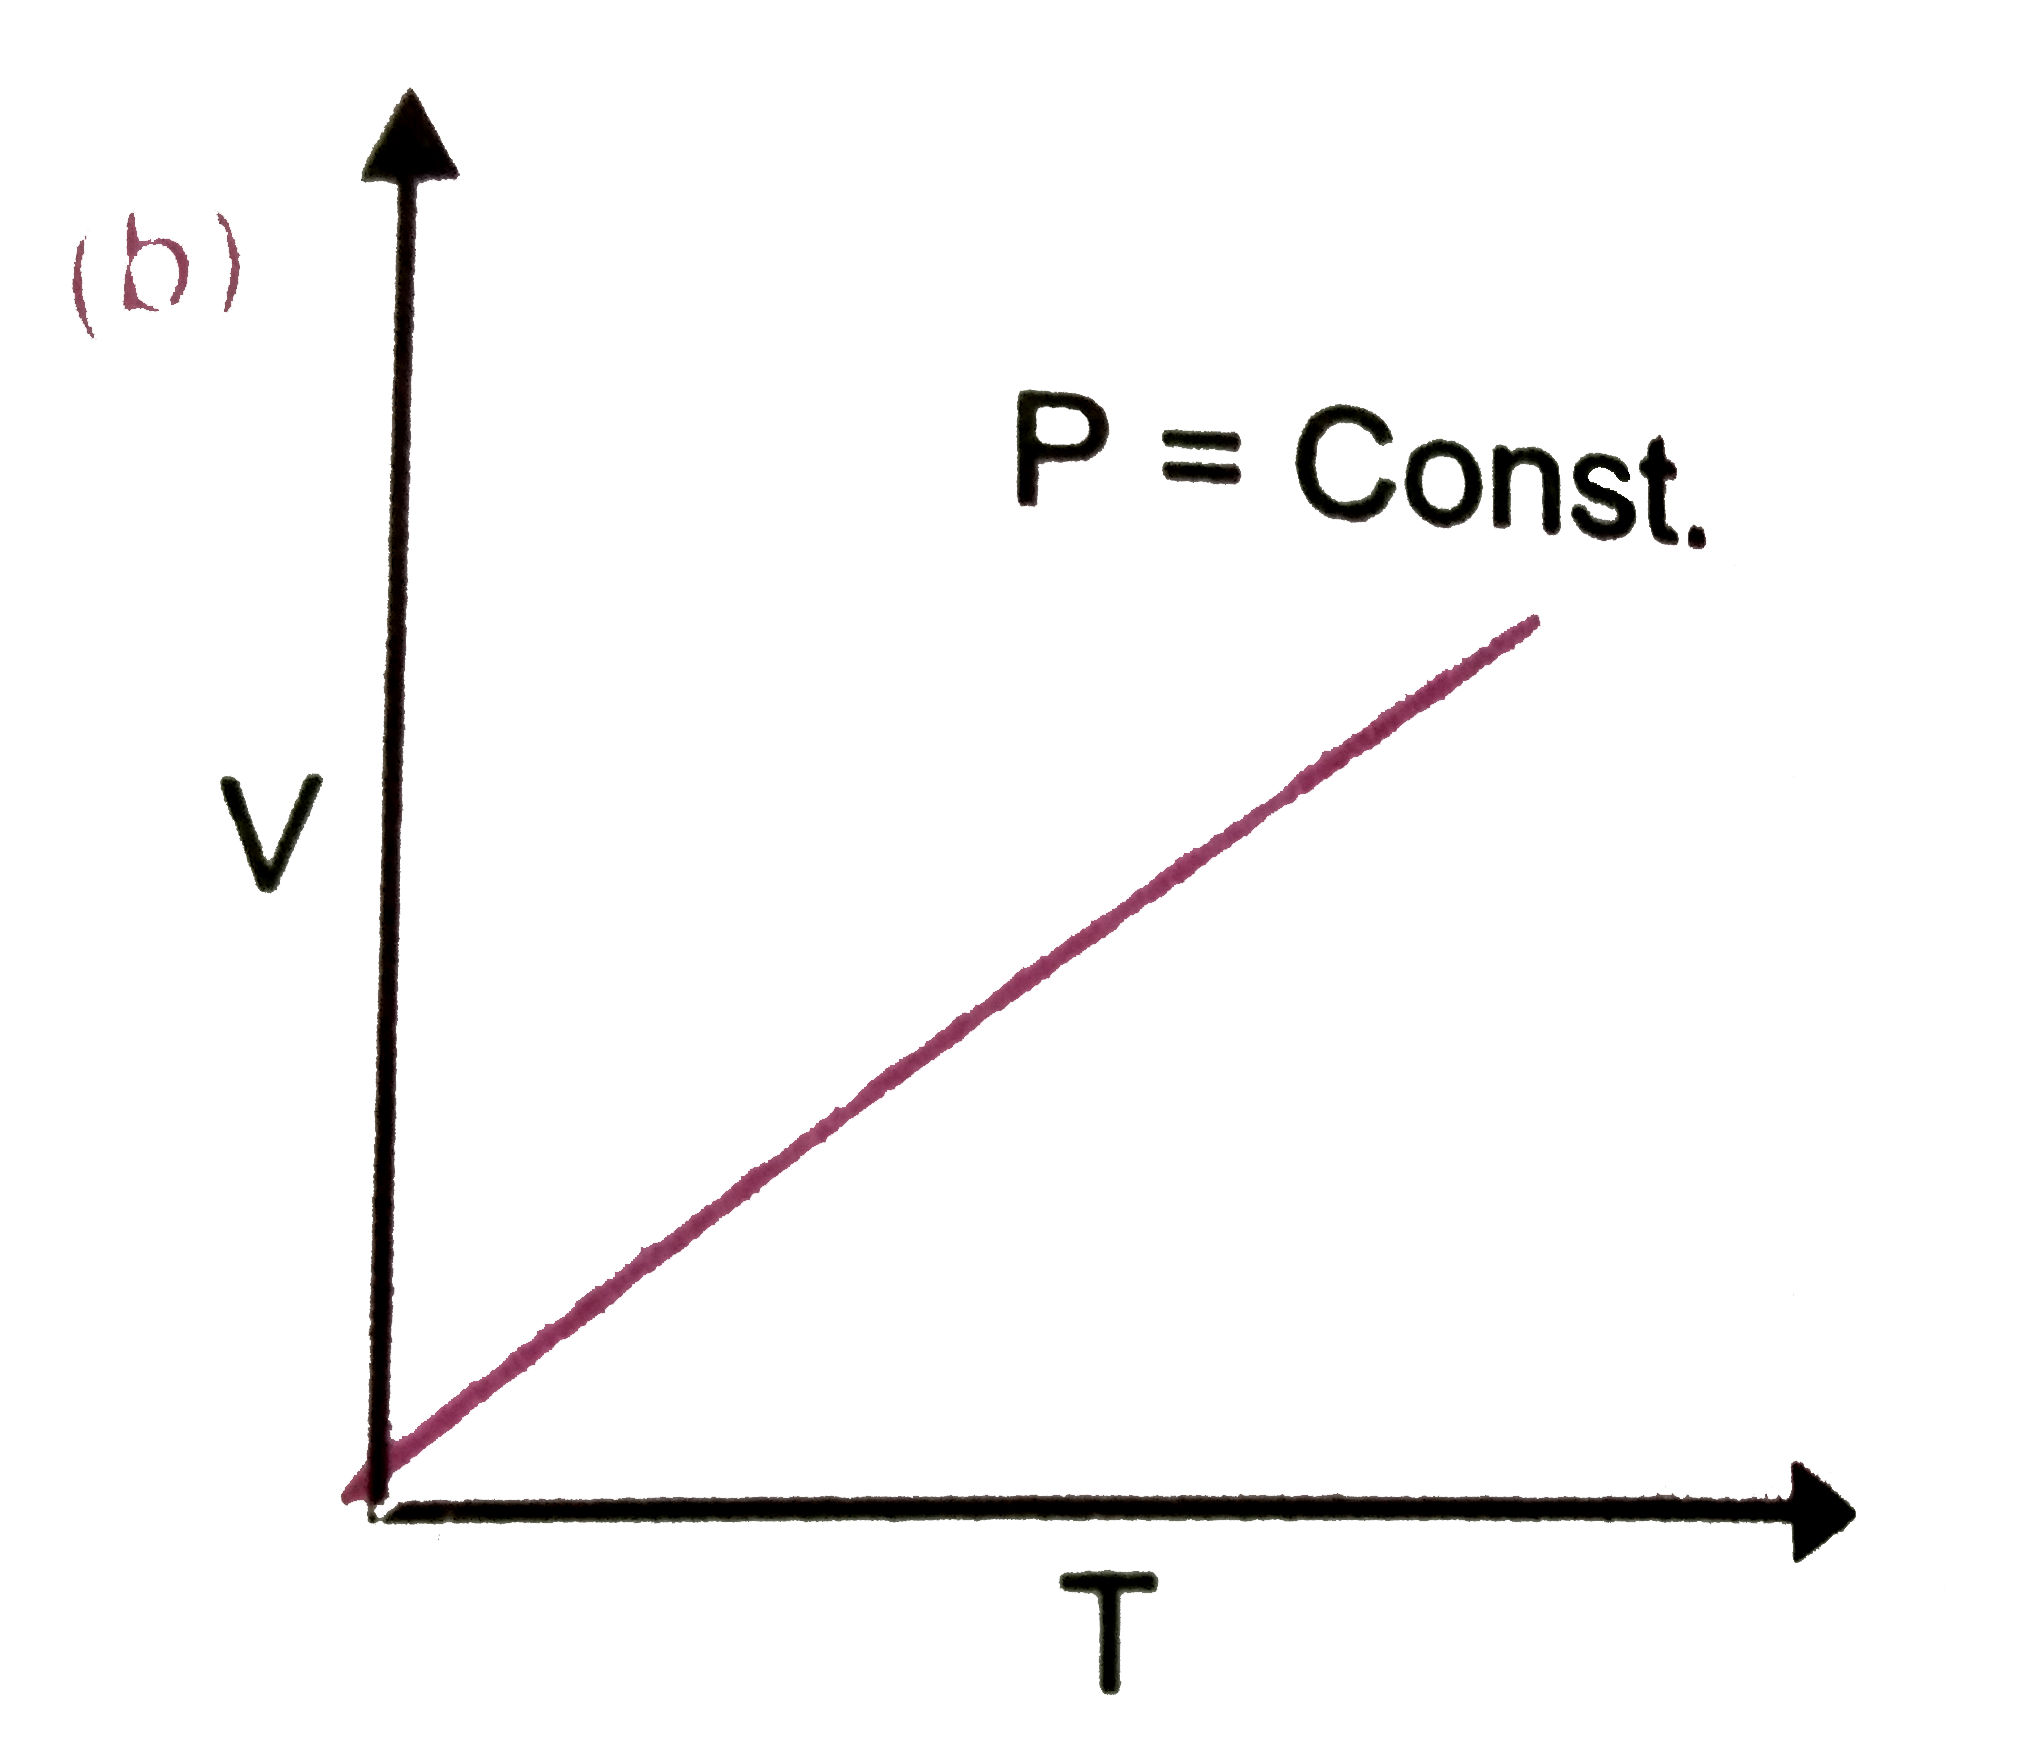
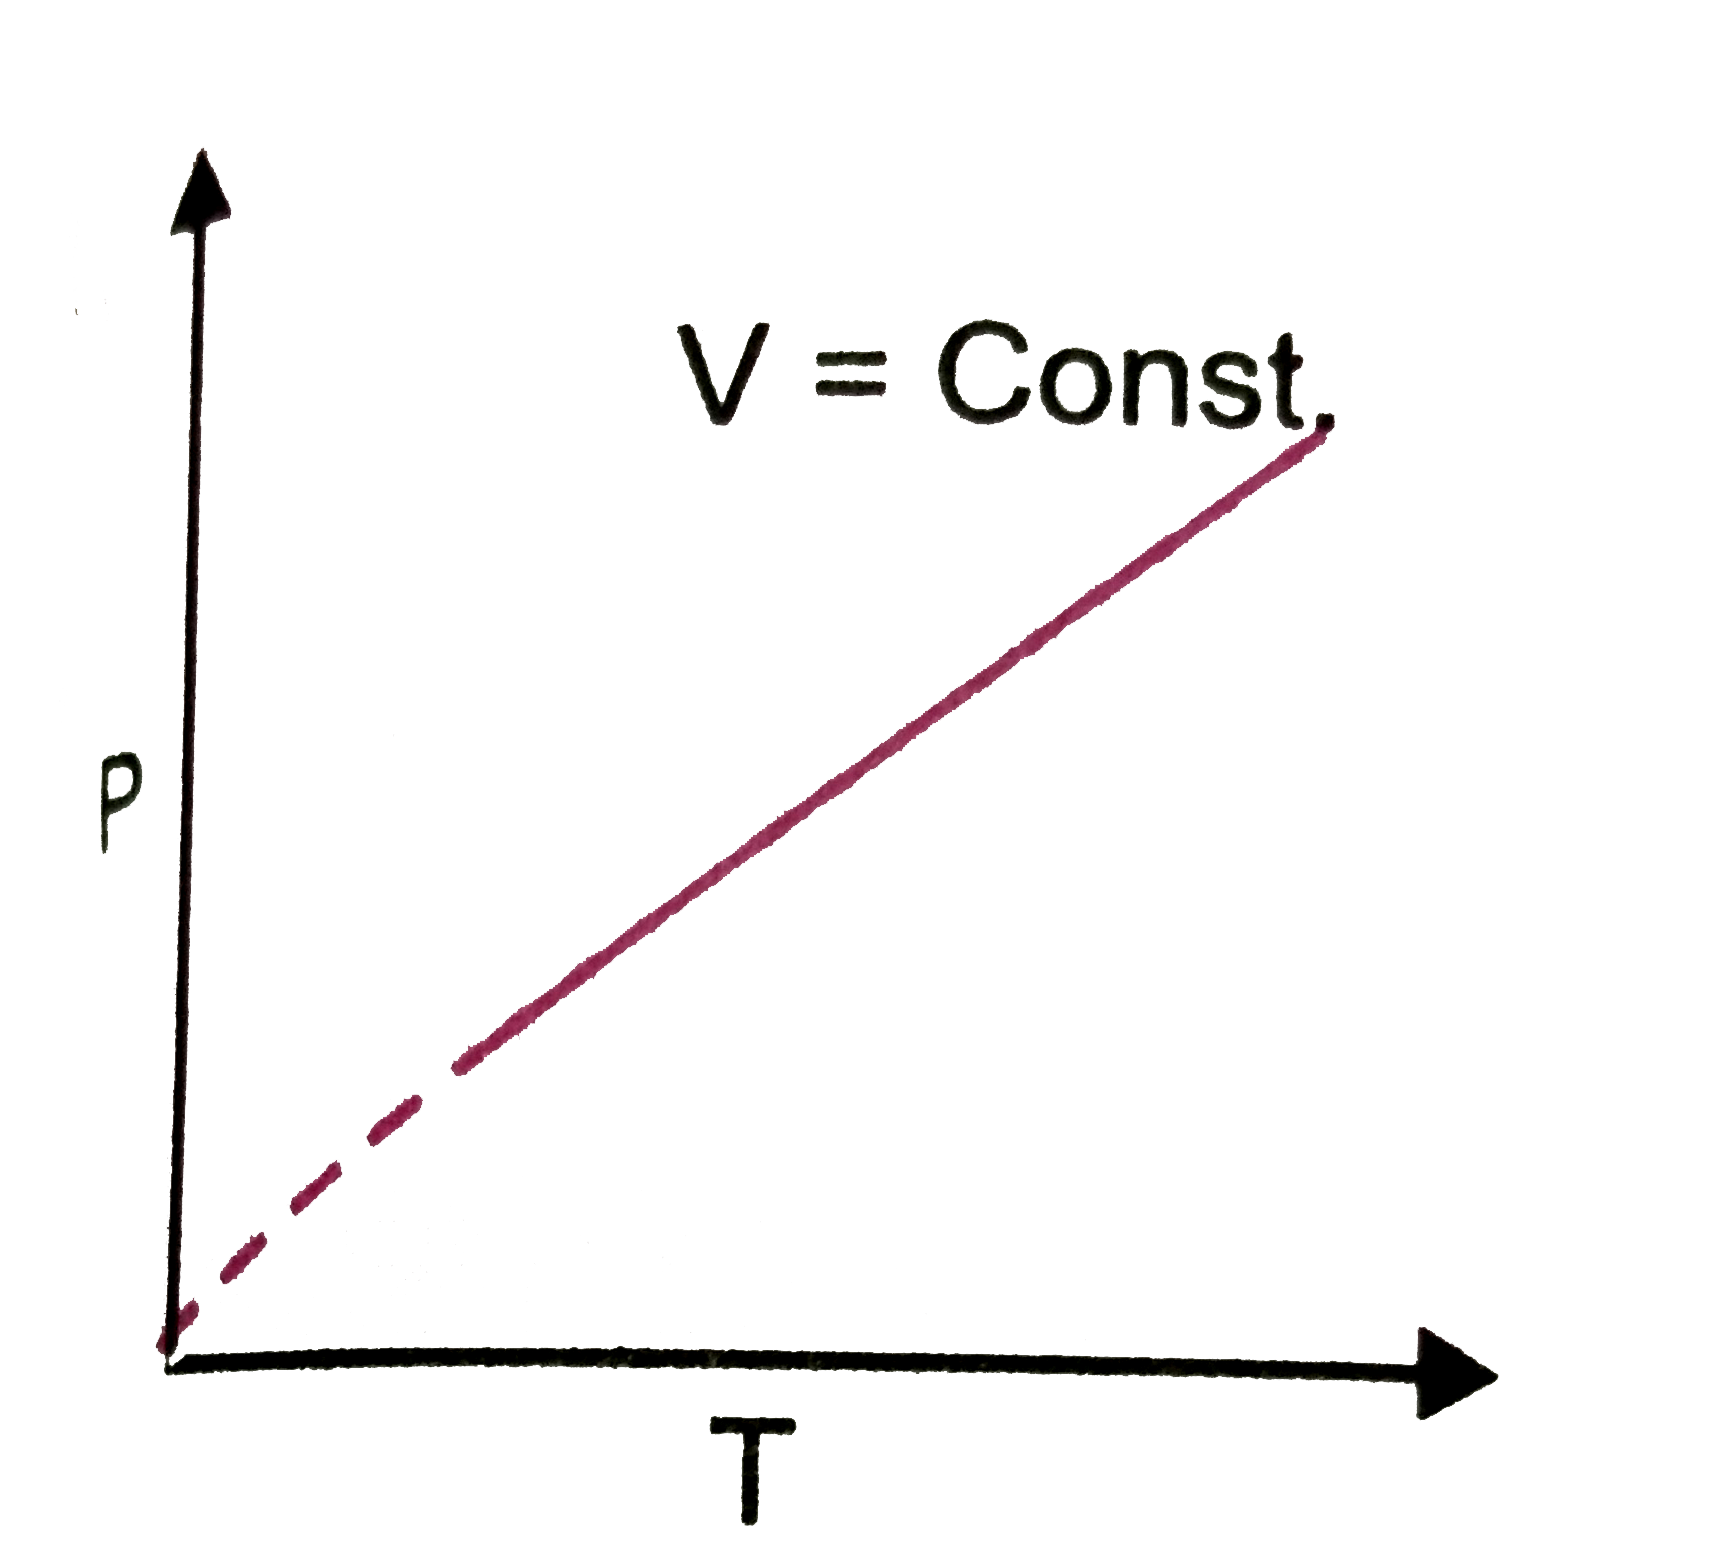
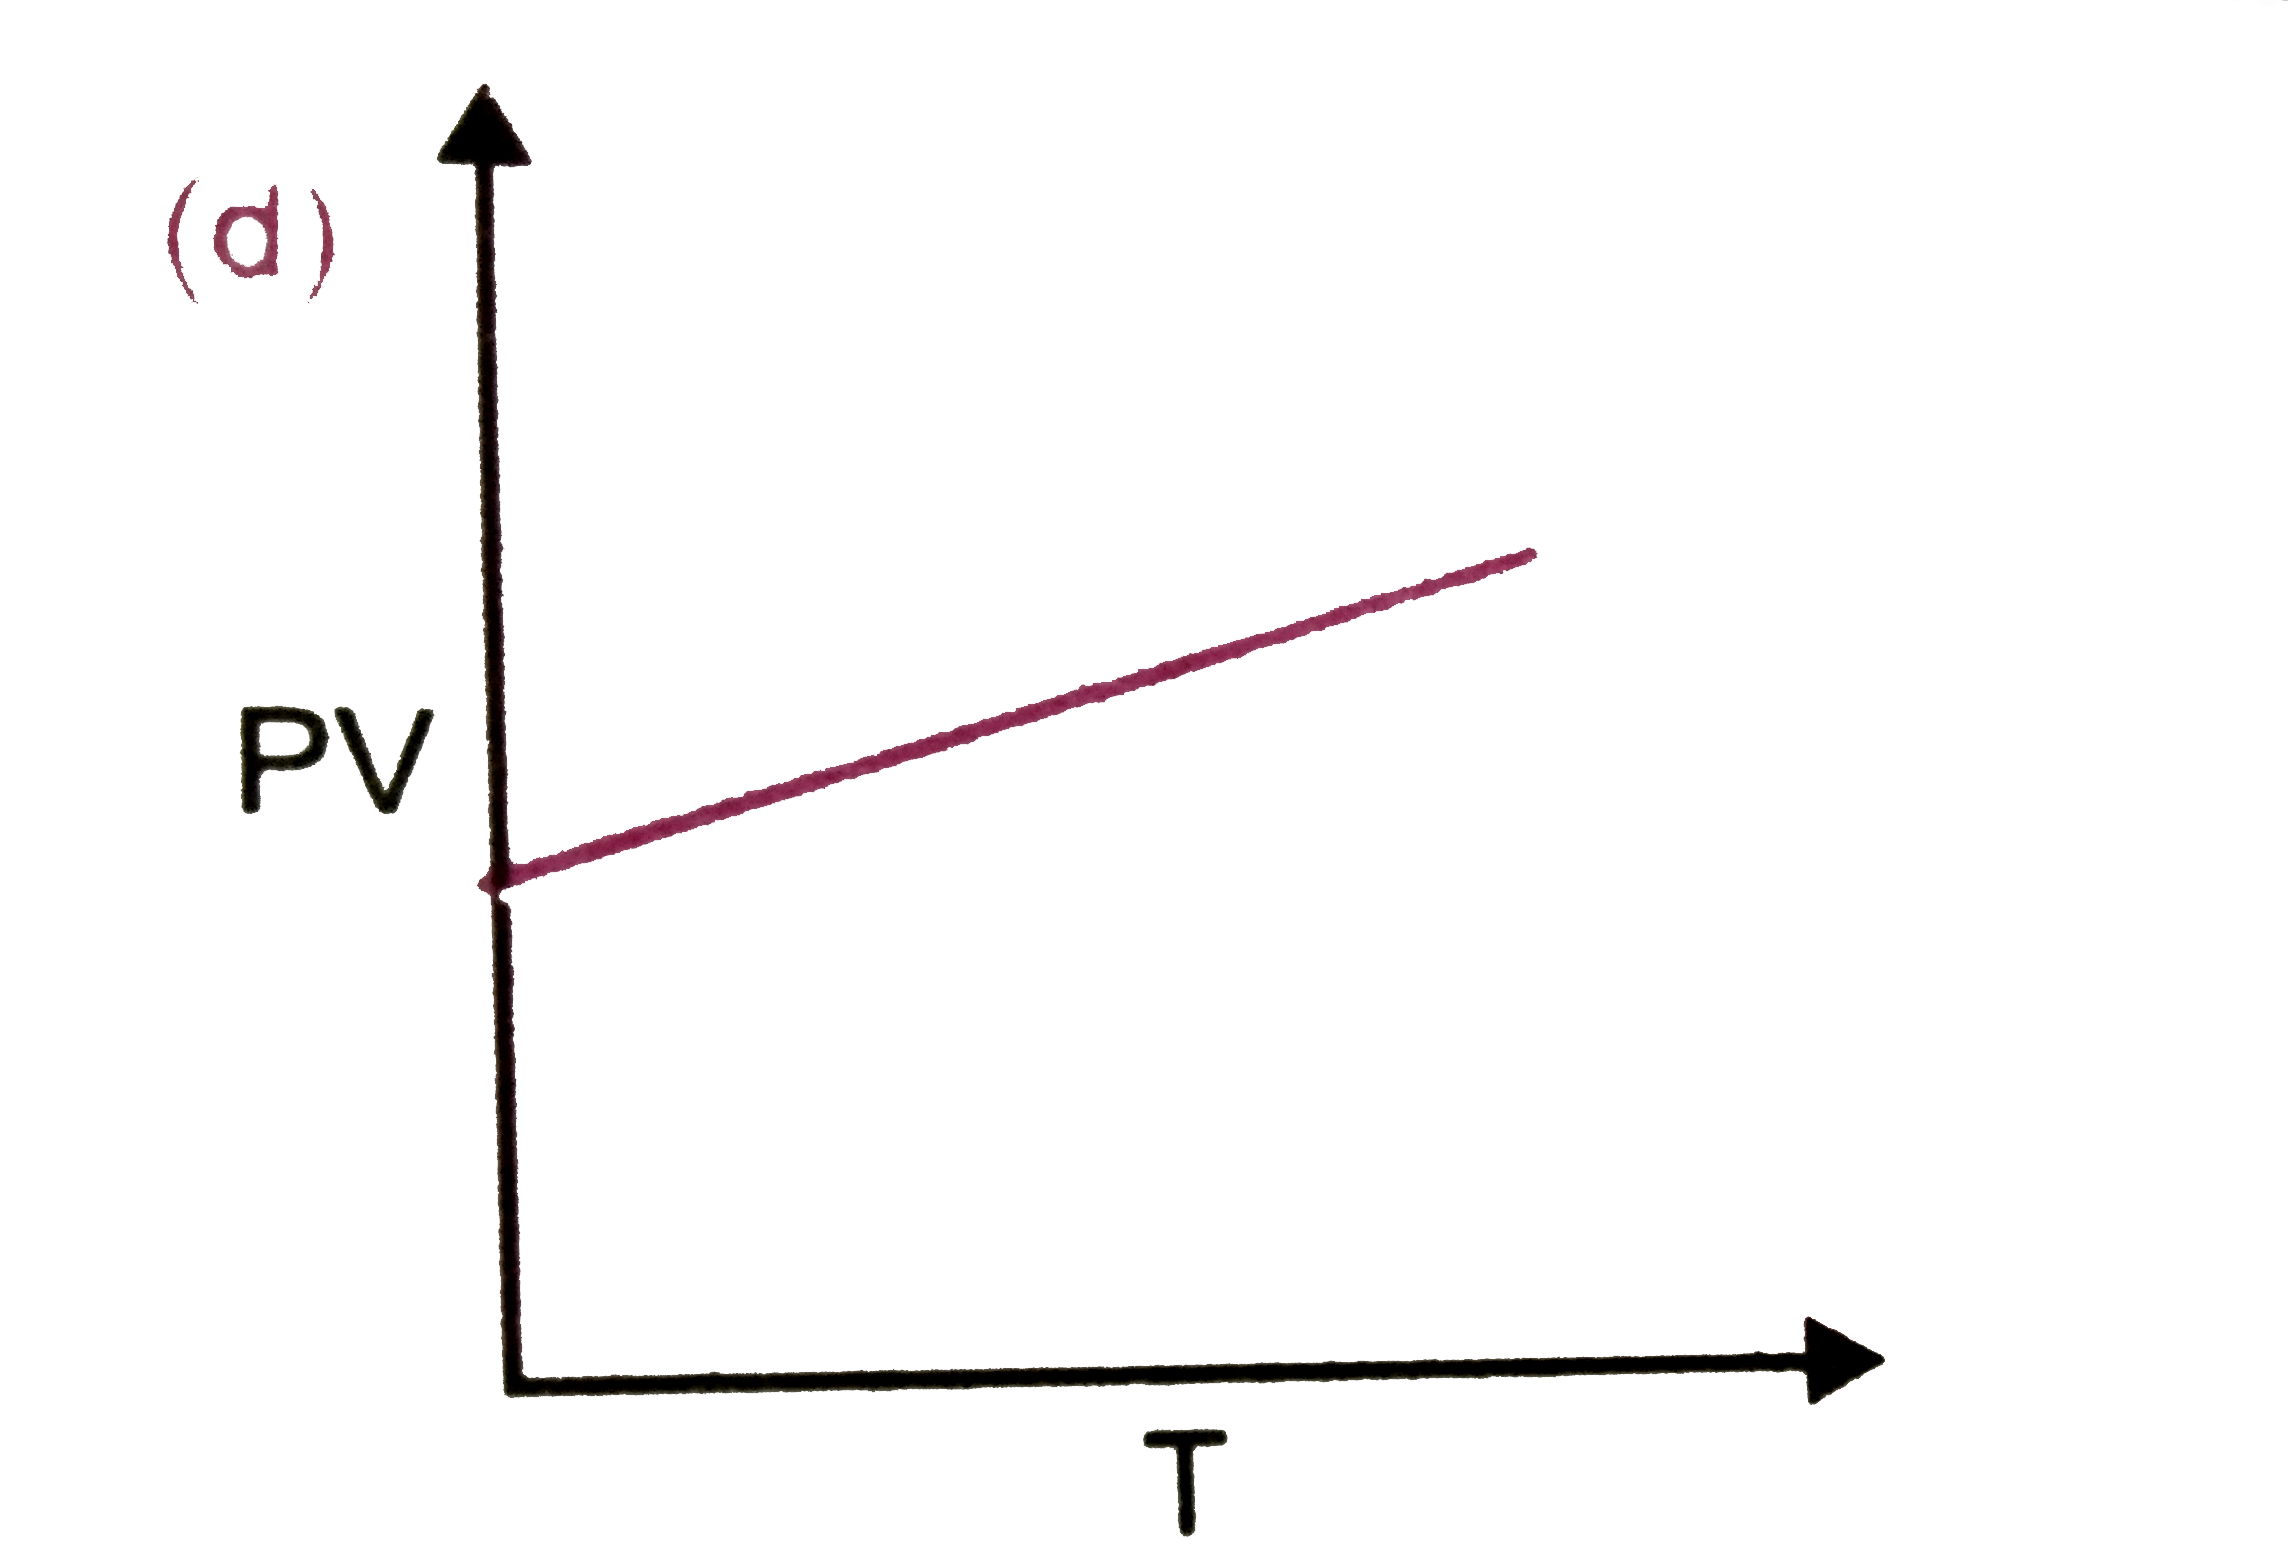
Which one of the following plots will be a parabola at constant temperature?
Pvs1V
PV vs P
V vs P
none of these
The correct Answer is:D
To determine which plot will be a parabola at constant temperature, we need to analyze the relationships between pressure (P) and volume (V) based on the ideal gas law and Boyle's law.
1. Understand Boyle's Law: Boyle's law states that at constant temperature, the pressure of a gas is inversely proportional to its volume. Mathematically, this can be expressed as:
P∝1V
or
PV=k
where k is a constant.
2. Analyze the Given Options: We need to evaluate the different plots provided in the options to see which one represents a parabolic relationship.
3. Option A: P vs 1/V:
- If we plot pressure (P) against the reciprocal of volume (1/V), we can express it as:
P=k⋅(1V)
- This is a linear relationship, which means the graph will be a straight line passing through the origin. Not a parabola.
4. Option B: PV vs P:
- Here, we have PV=k, which means that the product of pressure and volume is constant. If we plot PV against P, it will also yield a constant value. Not a parabola.
5. Option C: V vs P:
- If we plot volume (V) against pressure (P), we can rearrange Boyle's law to:
V=kP
- This represents a hyperbolic relationship, not a parabola. Not a parabola.
6. Option D: None of the above:
- Since none of the previous options yield a parabolic plot, the correct answer is that none of the provided options represent a parabola at constant temperature.
Conclusion:
The answer is D: None of these, as none of the plots given in the options results in a parabolic shape.
P∝1V
or
PV=k
where k is a constant.
- If we plot pressure (P) against the reciprocal of volume (1/V), we can express it as:
P=k⋅(1V)
- This is a linear relationship, which means the graph will be a straight line passing through the origin. Not a parabola.
- Here, we have PV=k, which means that the product of pressure and volume is constant. If we plot PV against P, it will also yield a constant value. Not a parabola.
- If we plot volume (V) against pressure (P), we can rearrange Boyle's law to:
V=kP
- This represents a hyperbolic relationship, not a parabola. Not a parabola.
- Since none of the previous options yield a parabolic plot, the correct answer is that none of the provided options represent a parabola at constant temperature.
The answer is D: None of these, as none of the plots given in the options results in a parabolic shape.
Topper's Solved these Questions
- MOLE CONCEPT, STOICHIOMETRY AND BEHAVIOUR OF GASES Book:MTG IIT JEE FOUNDATIONChapter:MOLE CONCEPT, STOICHIOMETRY AND BEHAVIOUR OF GASES Exercise:EXERCISE (MATCH THE FOLLOWING)
Explore 5 Videos
- MOLE CONCEPT, STOICHIOMETRY AND BEHAVIOUR OF GASES Book:MTG IIT JEE FOUNDATIONChapter:MOLE CONCEPT, STOICHIOMETRY AND BEHAVIOUR OF GASES Exercise:EXERCISE (ASSERTION & REASON TYPE)
Explore 10 Videos
- MOLE CONCEPT, STOICHIOMETRY AND BEHAVIOUR OF GASES Book:MTG IIT JEE FOUNDATIONChapter:MOLE CONCEPT, STOICHIOMETRY AND BEHAVIOUR OF GASES Exercise:SOLVED EXAMPLES
Explore 13 Videos
- METALS AND NON METALS Book:MTG IIT JEE FOUNDATIONChapter:METALS AND NON METALS Exercise:Olympiad/HOTS Corner
Explore 20 Videos
- PERIODIC CLASSIFICATION OF ELEMENTSBook:MTG IIT JEE FOUNDATIONChapter:PERIODIC CLASSIFICATION OF ELEMENTSExercise:Olympiad/HOTS Corner
Explore 15 Videos
Similar Questions
Knowledge Check
Which one of the following plot will be a hyperbola at constant temperature ?
AP vs 1VBPV vs PCV vs PDNone of theseWhich of the following plot will not be linear ?
APlot of logxm versus PBPlot of Px/m versus PCPlot of mx versus 1PDPlot of logmx versus log PWhich of the following plots are correct ?
A B
B C
C D
D
Which of the following plots is/are correct?
View SolutionFor which of the following reactions at equilibrium at constant temperature, doubling the volume will cause a shift to the right?
View SolutionWhich of the following will give a linear plot at constant pressure ?
View SolutionWhich of the following will give linear plots ?
View SolutionWhich of the following group of animals have a constant body temperature?
View Solution