The expected graphical representation of the variation of angle of deviation 'δ' with angle of incidence 'i' in a prism is :
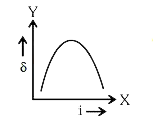
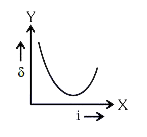
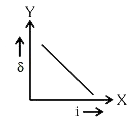
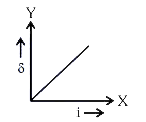
The correct Answer is:B
To solve the problem of the graphical representation of the variation of angle of deviation (Δ) with angle of incidence (i) in a prism, we need to understand the relationship between these two angles.
1. Understanding the Relationship:
- The angle of deviation (Δ) is the angle by which light is deviated from its original path after passing through a prism.
- As the angle of incidence (i) increases, the angle of deviation (Δ) initially decreases.
2. Minimum Deviation:
- There exists a specific angle of incidence (i_min) at which the angle of deviation (Δ) reaches its minimum value (Δ_min). This is a critical point in the graph.
3. Behavior Beyond Minimum Deviation:
- After reaching the minimum deviation, if the angle of incidence continues to increase, the angle of deviation starts to increase again. This means that beyond i_min, Δ increases with increasing i.
4. Graphical Representation:
- The graph starts with Δ decreasing as i increases, reaches a minimum value at i_min, and then starts to increase again as i continues to increase.
- Therefore, the graph has a U-shaped curve, where the lowest point corresponds to the minimum deviation.
5. Conclusion:
- The expected graphical representation of the variation of angle of deviation Δ with angle of incidence i in a prism is a curve that decreases to a minimum point and then increases again.
- The angle of deviation (Δ) is the angle by which light is deviated from its original path after passing through a prism.
- As the angle of incidence (i) increases, the angle of deviation (Δ) initially decreases.
- There exists a specific angle of incidence (i_min) at which the angle of deviation (Δ) reaches its minimum value (Δ_min). This is a critical point in the graph.
- After reaching the minimum deviation, if the angle of incidence continues to increase, the angle of deviation starts to increase again. This means that beyond i_min, Δ increases with increasing i.
- The graph starts with Δ decreasing as i increases, reaches a minimum value at i_min, and then starts to increase again as i continues to increase.
- Therefore, the graph has a U-shaped curve, where the lowest point corresponds to the minimum deviation.
- The expected graphical representation of the variation of angle of deviation Δ with angle of incidence i in a prism is a curve that decreases to a minimum point and then increases again.
Similar Questions
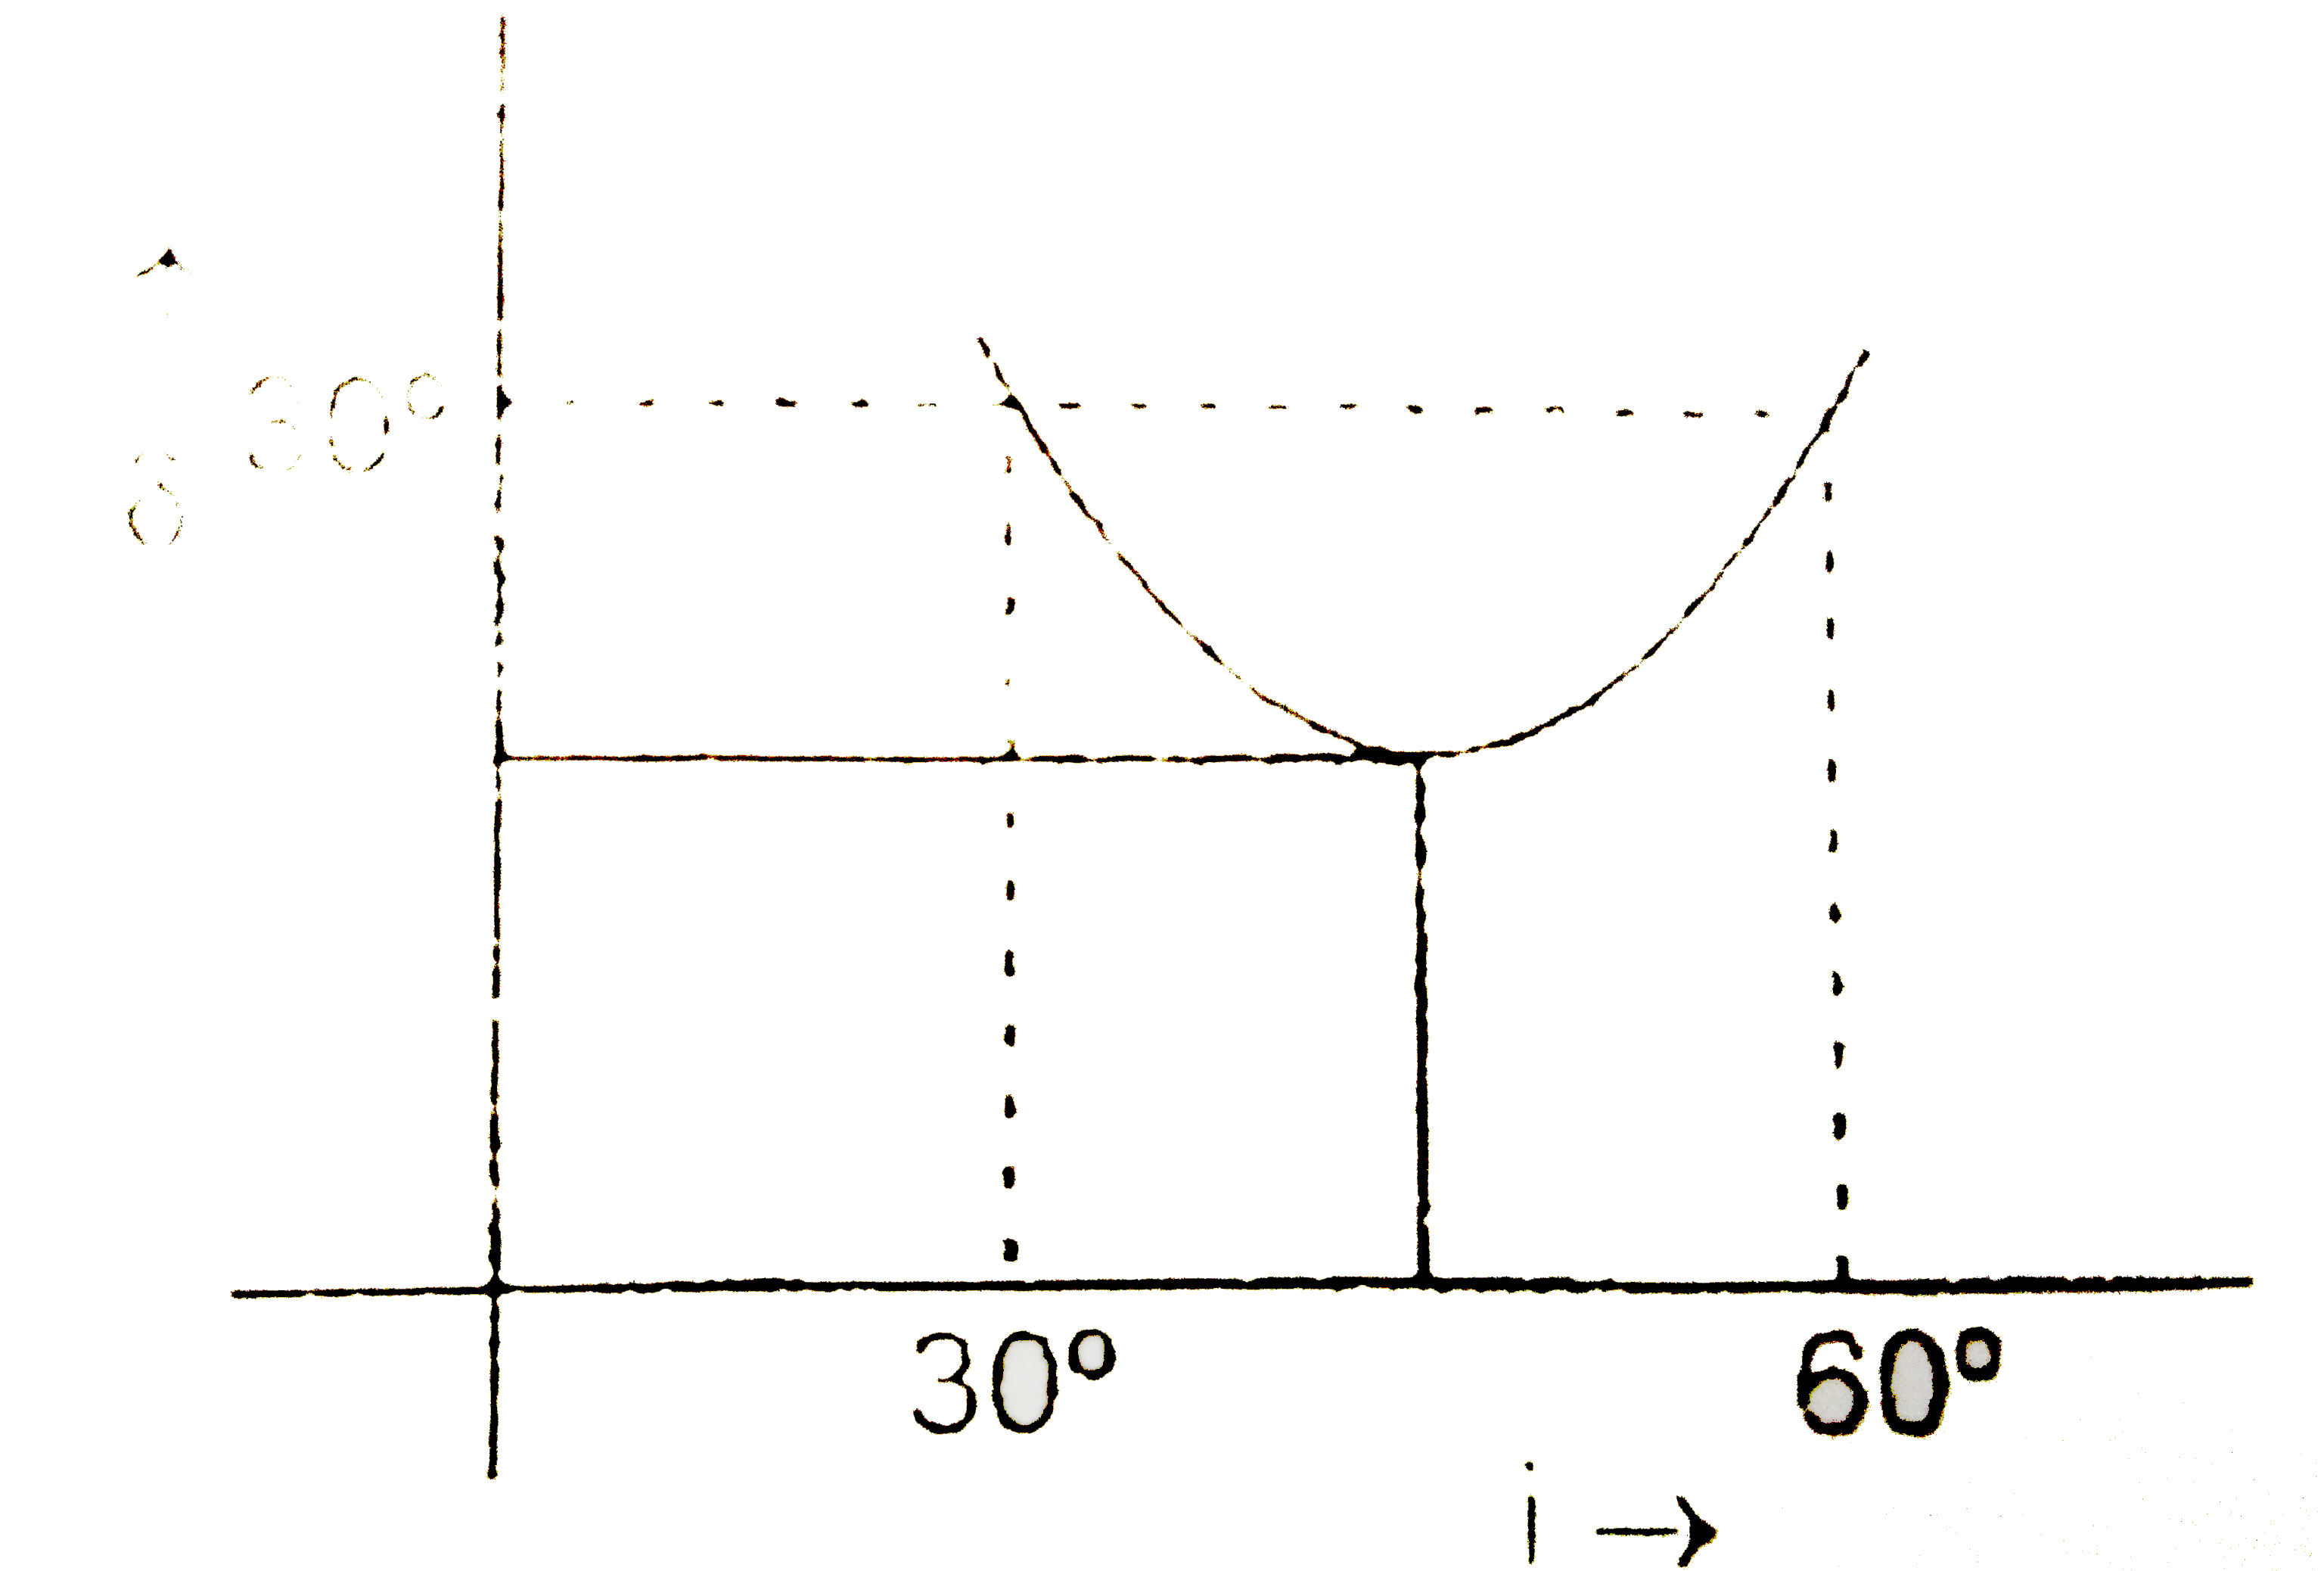
From the graph fo angle of deviation δ versus angle of incidwence i. Find the prism angle
View SolutionDefine refractive index of a transparent medium. A ray of light passes through a triangular prism. Plot a graph showing the variation of angle of deviation with the angle of incidence. Hence derive prism formula.
View Solution
Knowledge Check
The graph between angle of deviation (δ) and angle of incidence (i) for a triangular prism is represented by
A B
B C
C D
D
The graph between angle of deviation (δ) and angle of incidence (i) for a triangular prism is represented by
A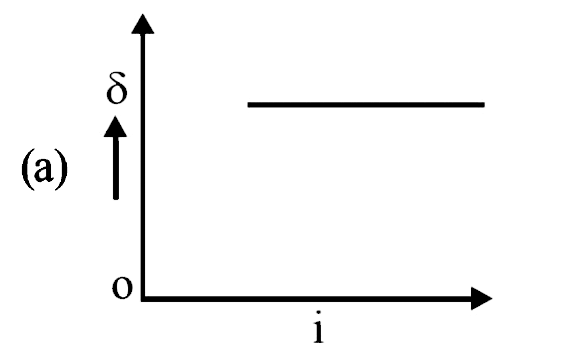 B
B C
C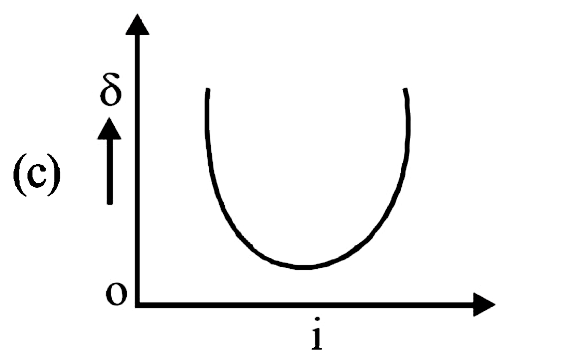 D
D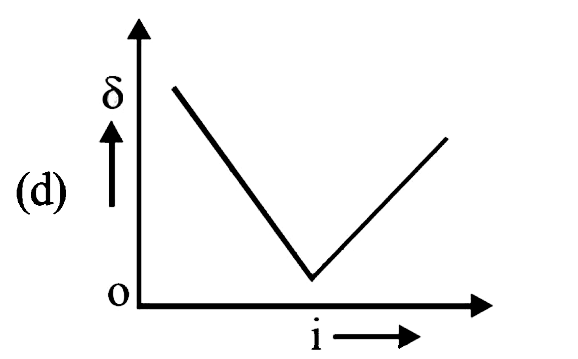
The graph between angle of deviation (δ) and angle of incidence (i) for a triangular prism is represented by
A<imga≤ocr_imageload∈g=lazysrc=https://d10lpgp6xz60nq.cloudfront.net/physics_images/NAR_NEET_PHY_XII_P3_C09_E06_027_O01.pngwh=80%mx-autosty≤=background:white;>B C
C D
D
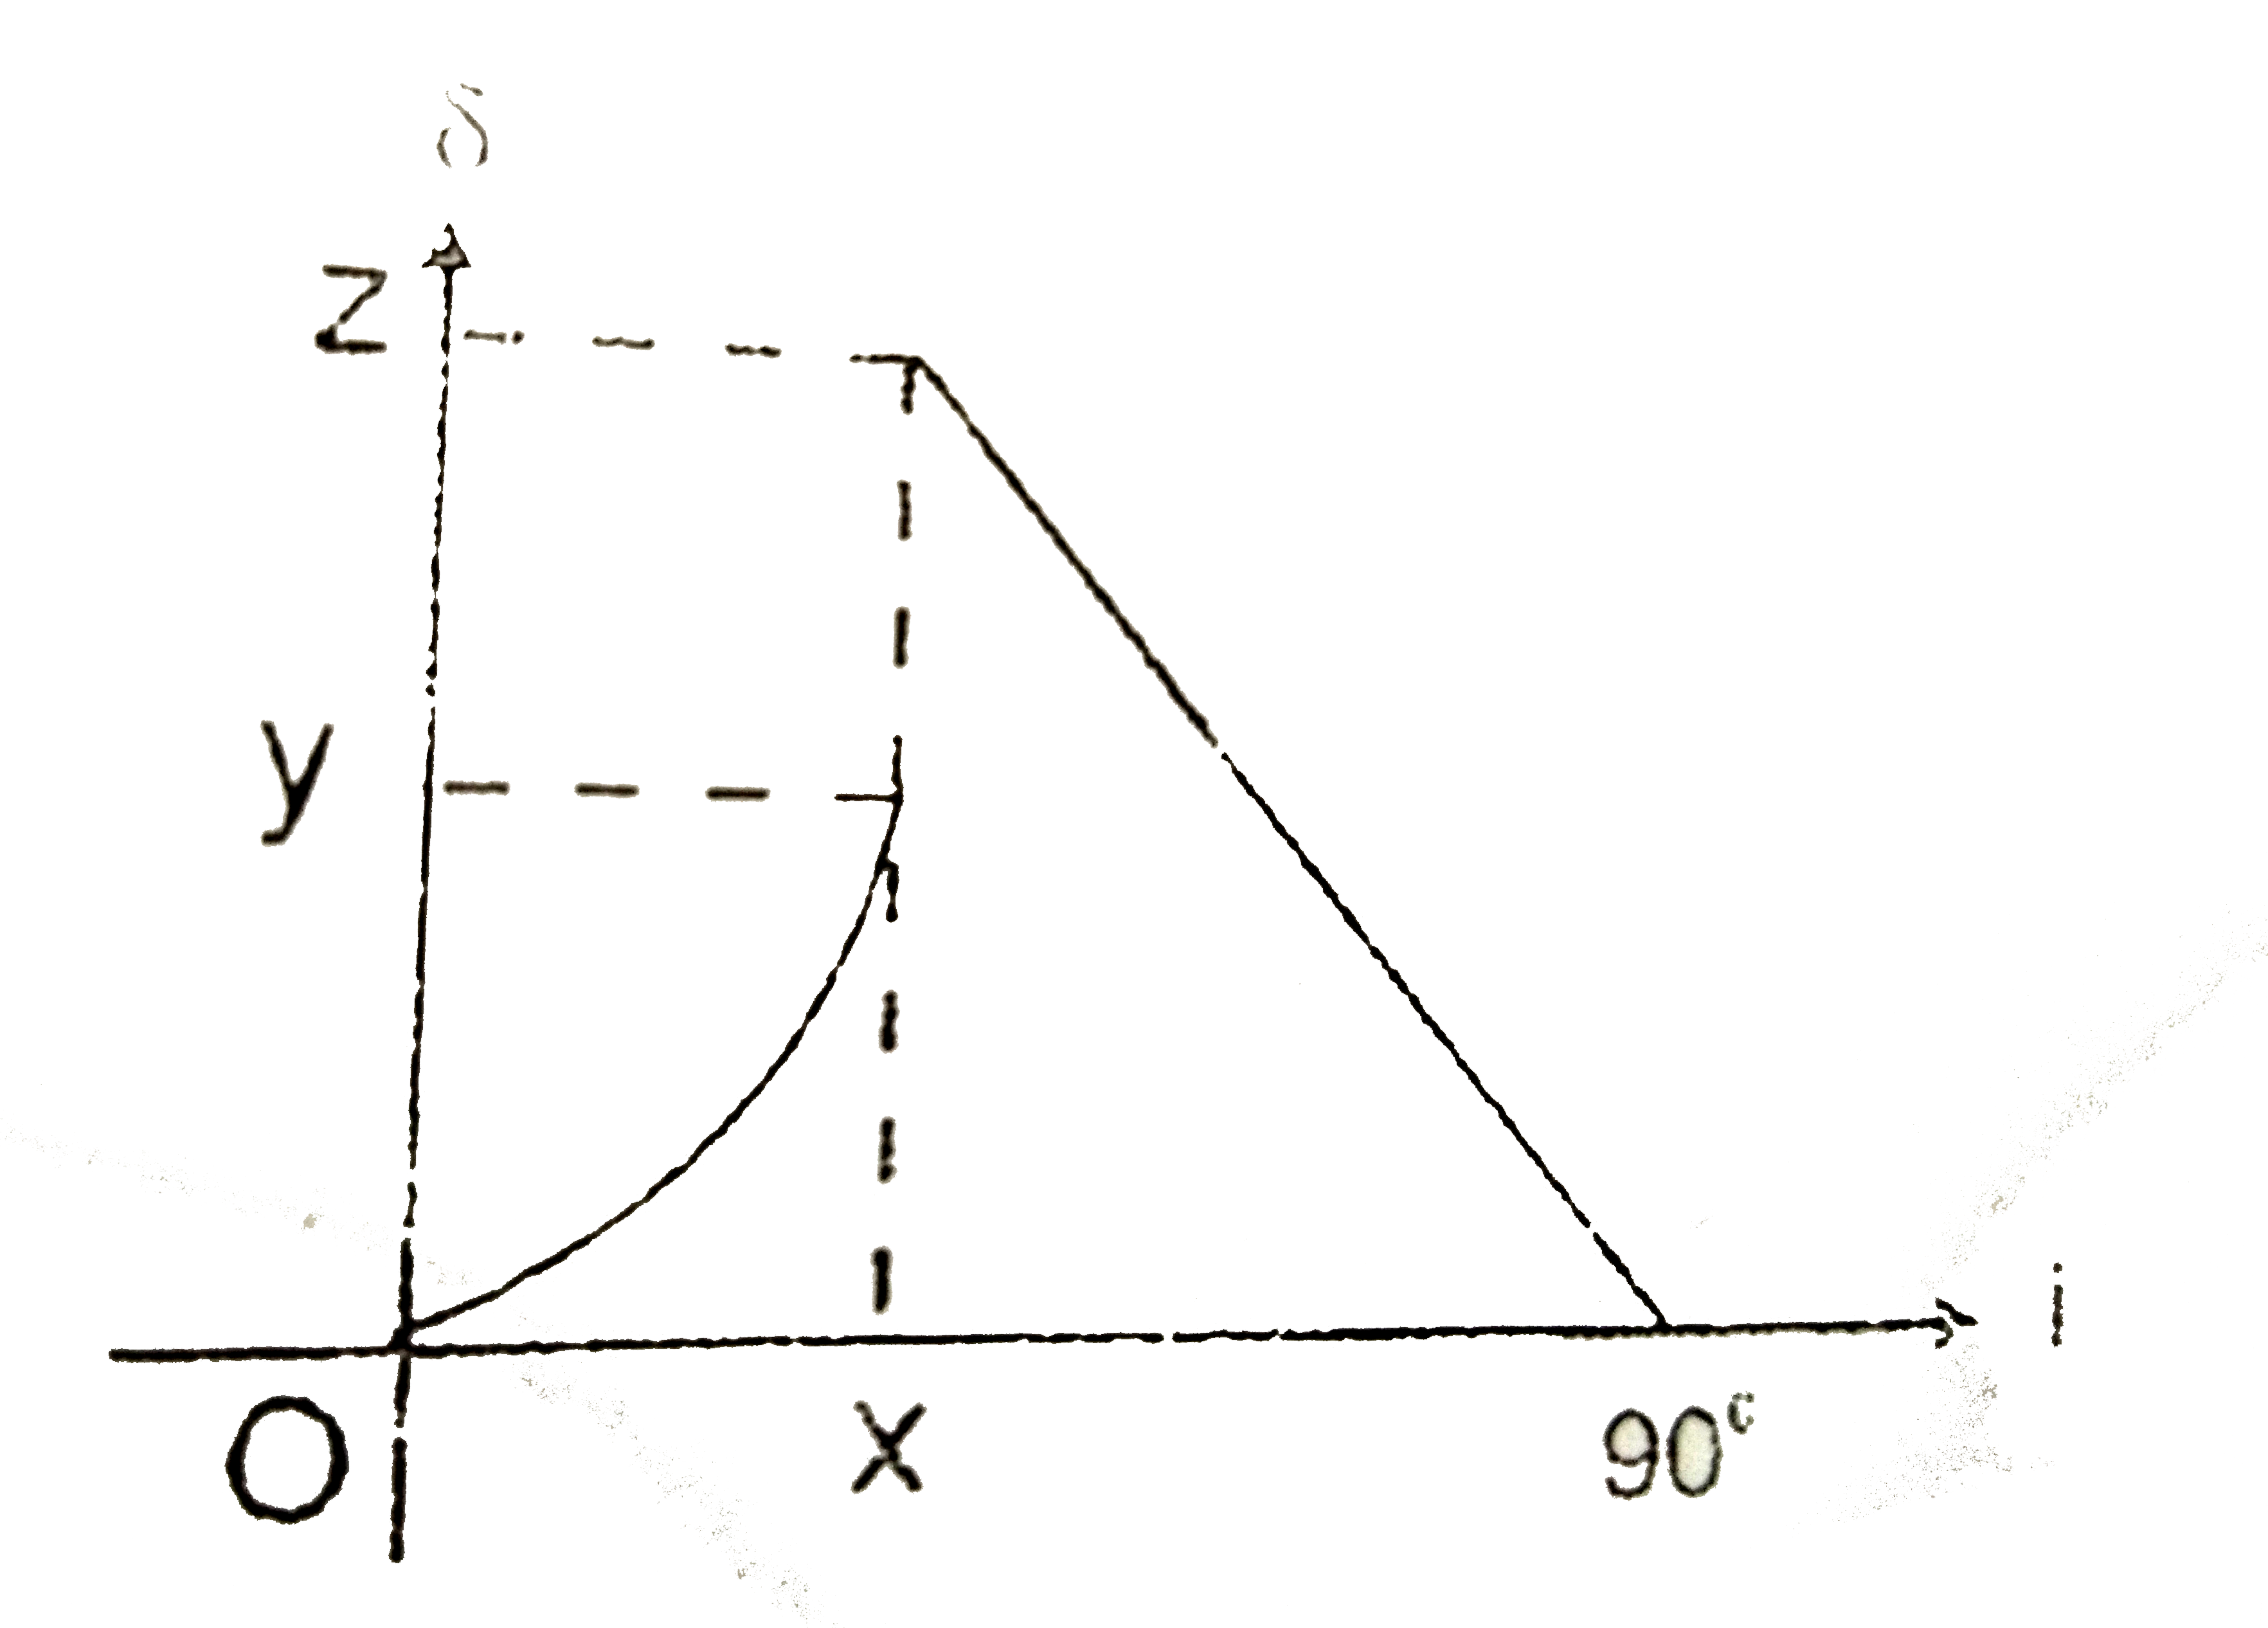
Light is incident from glass to are. The variation of the angle of deviation δ with the angle of incidence i for 0<i<90∘ If the value of (x+y+z) is (npi)/(6) then value of n.
View SolutionPlot a graph to show the variation of the angle of deviation as a function of angle of incidence for light rays passing through a prism. Write the relation for the refractive index of the prism in terms of the angle of minimum deviation and the angle of the prism.
View SolutionPlot a graph to show variation of the angle of deviation as a function of angel of incidence for light passing through a prism. Derive an expression for refractive index of the prism in terms of angle of minimum deviation and angle of prism.
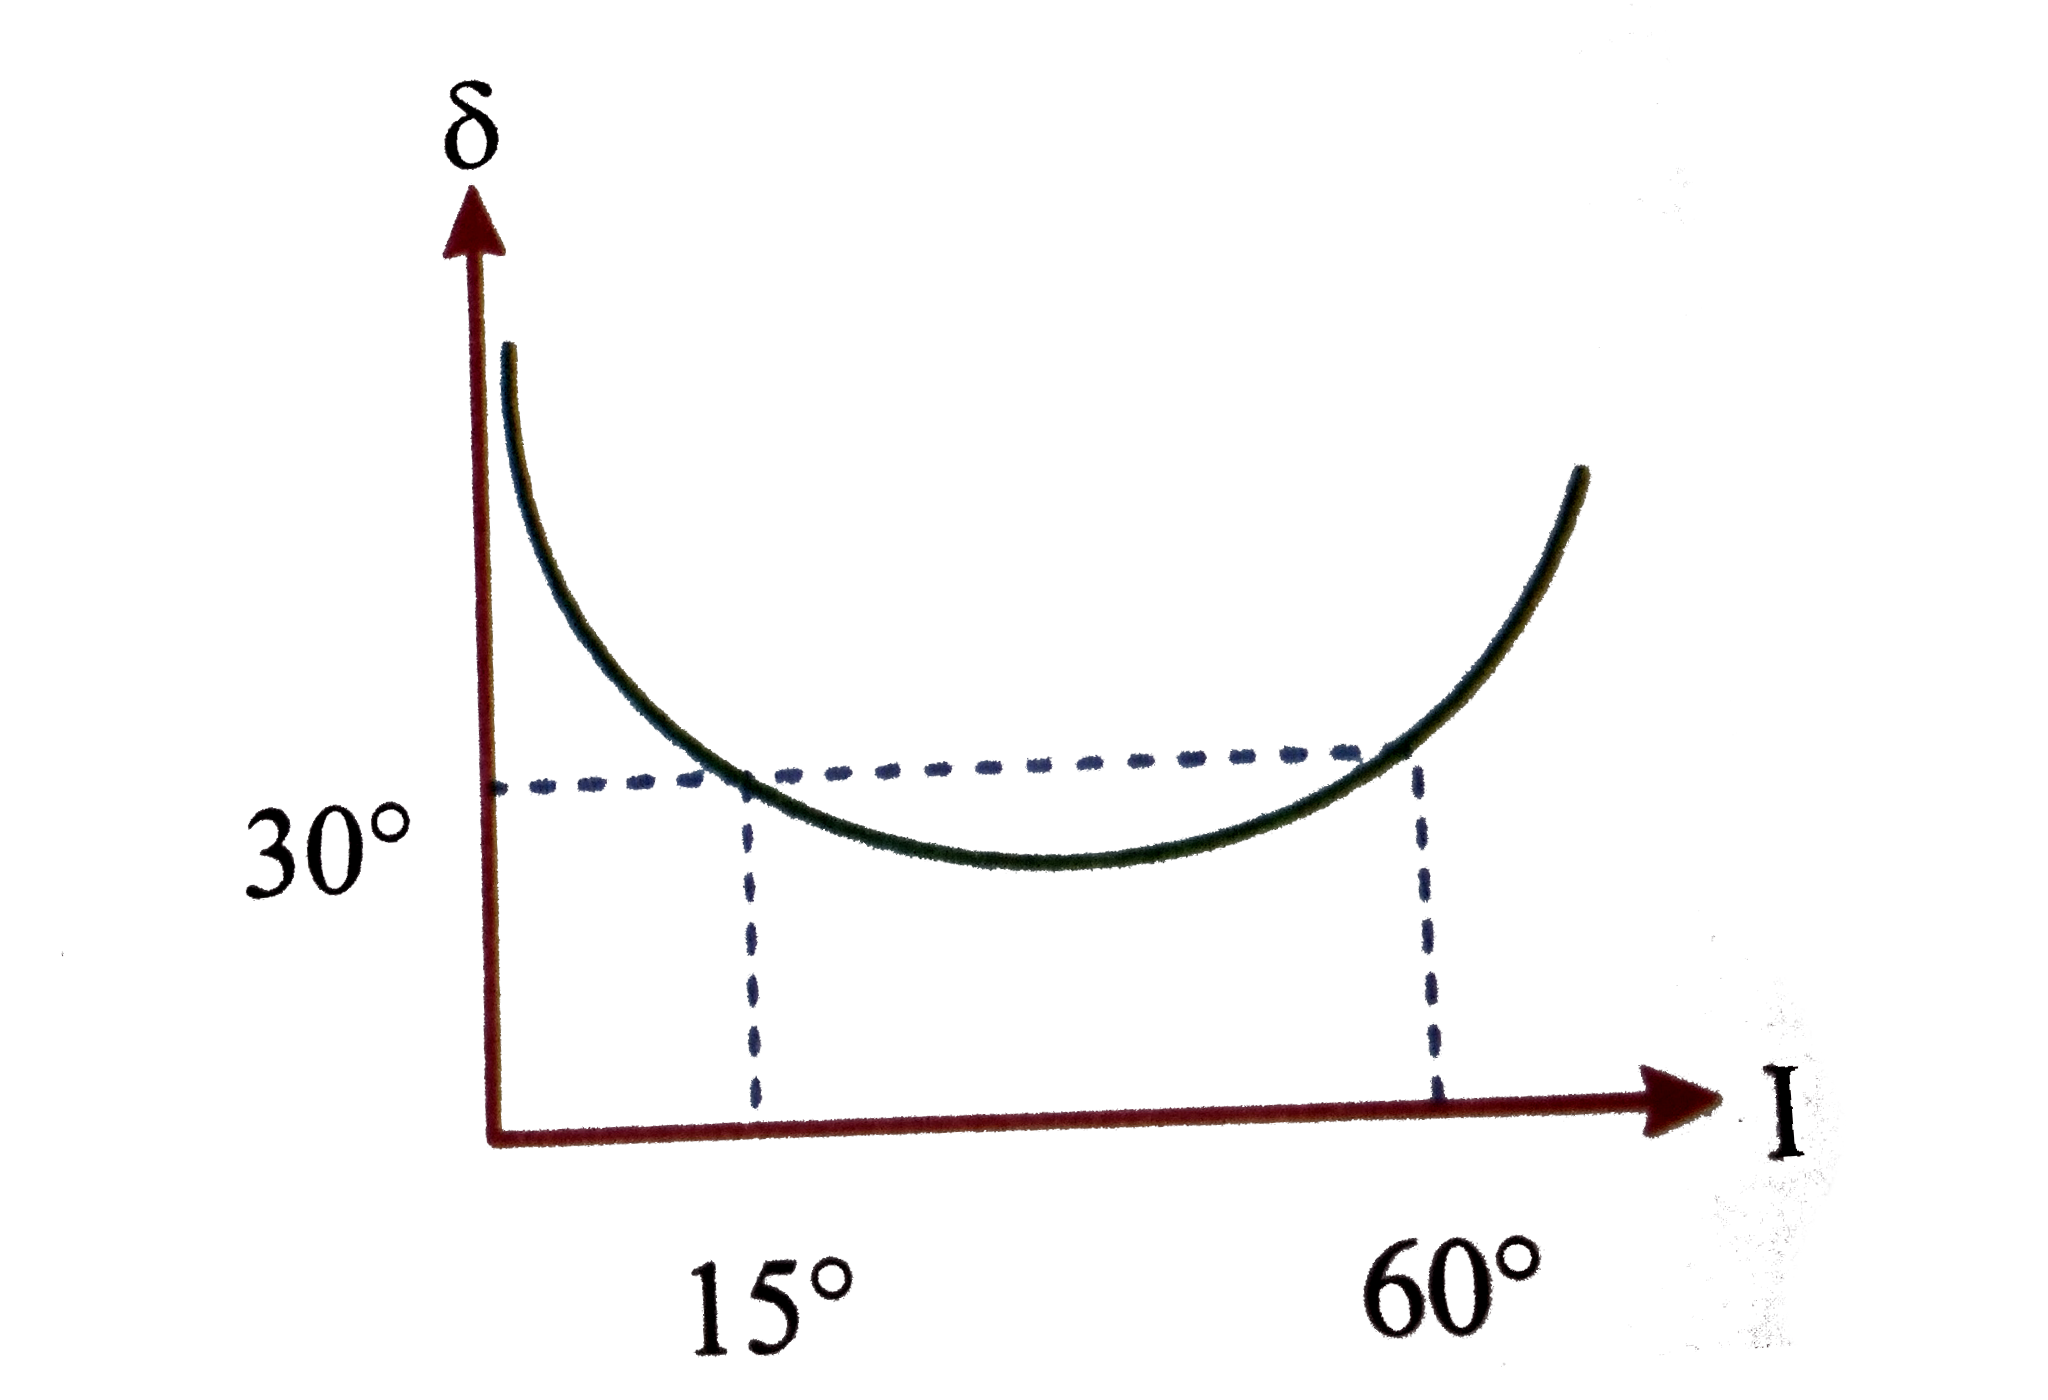
View SolutionFigure shows the graph of angle of deviation ∂ versus angle of incidence i for a light ray striking a prism. The prism angle is
View SolutionFor thin prism angle of minimum deviation(δ) is given by
View Solution

