This is a pie-chart for the data on A, B, O, AB blood groups of 150 donors. Observe the pie-chart and answer the questions.
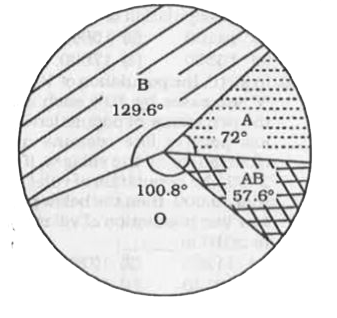
What is the percentage of donors having blood group 'AB'?
61%
26%
16%
36%
The correct Answer is:C
Step by step video, text & image solution for This is a pie-chart for the data on A, B, O, AB blood groups of 150 donors. Observe the pie-chart and answer the questions. What is the percentage of donors having blood group 'AB'? by Maths experts to help you in doubts & scoring excellent marks in Class 14 exams.
Topper's Solved these Questions
- BOOK - KIRAN PUBLICATIONCHAPTER - STATISTICS AND DATA INTERPRETATIONEXERCISE - TYPE-VIII8videos
STATISTICS AND DATA INTERPRETATION
- BOOK - KIRAN PUBLICATIONCHAPTER - STATISTICS AND DATA INTERPRETATIONEXERCISE - TYPE-VI86videos
STATISTICS AND DATA INTERPRETATION
- BOOK - KIRAN PUBLICATIONCHAPTER - SIMPLIFICATIONEXERCISE - TEST YOURSELF25videos
SIMPLIFICATION
- BOOK - KIRAN PUBLICATIONCHAPTER - TIME AND DISTANCEEXERCISE - Type -XI74videos
TIME AND DISTANCE
Similar Questions
Knowledge Check
- Question 1 - Select One
This is a pie-chart for the data on A, B, O, AB blood groups of 150 donors. Observe the pie-chart and answer the questions.
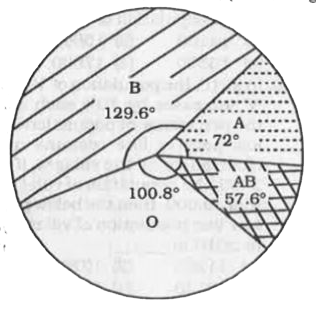
The ratio of donors having blood group 'A' to the average of the donors having blood group 'O', 'B' and 'AB' is :A4:3B4:5C5:4D3:4 - Question 2 - Select One
This is a pie-chart for the data on A, B, O, AB blood groups of 150 donors. Observe the pie-chart and answer the questions.
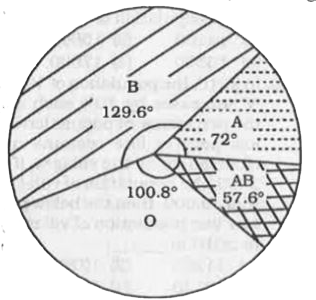
The number of donor having blood group 'O' is :A50B42C30D34 - Question 3 - Select One
This is a pie-chart for the data on A, B, O, AB blood groups of 150 donors. Observe the pie-chart and answer the questions.
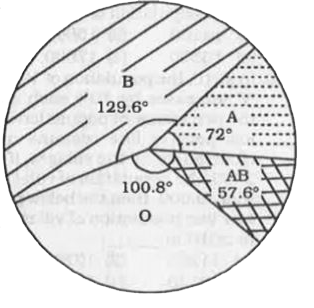
The number of persons having either blood group 'A' or blood group 'B' is :A84B96C78D54
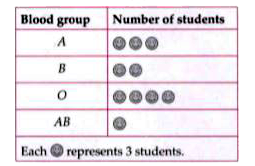
Observe the following pictograph and answer the following questions.
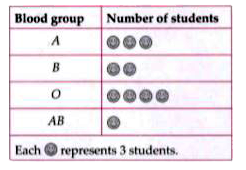
The ratio of the frequencies of blood group AB to blood group O isView SolutionUniversal donor blood group is
View SolutionWhich blood group is kwon as universal donor?
View SolutionThe given pie chart shows the percentage distribution of 450 employees in an organisation. Read the pie chart and answer the question that follows.
Percentage of Employees in different Departments (Total 450 Employees )
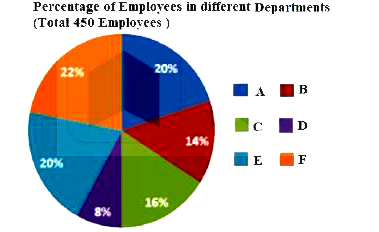
What is the number of employees working in department F?View SolutionPeople of AB blood group have :
View Solution

