The line chart given below shows the ratio of poduction to sales of two bike-manufacturing firms over the period of 6 years.
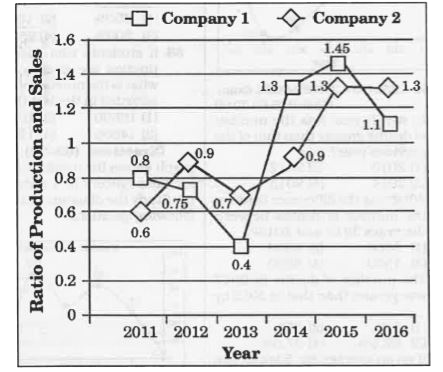
Assume if in any year sales is more than production then both the companies have sufficient stock to meet such instances.
If the sales of company 1 in year 2015 was 50000 units, then what was its production (in units) in year 2015?
38460
45000
52000
65000
The correct Answer is:D
Step by step video, text & image solution for The line chart given below shows the ratio of poduction to sales of two bike-manufacturing firms over the period of 6 years. Assume if in any year sales is more than production then both the companies have sufficient stock to meet such instances. If the sales of company 1 in year 2015 was 50000 units, then what was its production (in units) in year 2015? by Maths experts to help you in doubts & scoring excellent marks in Class 14 exams.
Updated on:21/07/2023Topper's Solved these Questions
- STATISTICS AND DATA INTERPRETATIONBOOK - KIRAN PUBLICATIONCHAPTER - STATISTICS AND DATA INTERPRETATIONEXERCISE - TYPE-VII
363 Videos
- STATISTICS AND DATA INTERPRETATIONBOOK - KIRAN PUBLICATIONCHAPTER - STATISTICS AND DATA INTERPRETATIONEXERCISE - TYPE-VIII
8 Videos
- STATISTICS AND DATA INTERPRETATIONBOOK - KIRAN PUBLICATIONCHAPTER - STATISTICS AND DATA INTERPRETATIONEXERCISE - TYPE-V
38 Videos
- SIMPLIFICATIONBOOK - KIRAN PUBLICATIONCHAPTER - SIMPLIFICATIONEXERCISE - TEST YOURSELF
25 Videos
- TIME AND DISTANCEBOOK - KIRAN PUBLICATIONCHAPTER - TIME AND DISTANCEEXERCISE - Type -XI
74 Videos
Similar Questions
The line chart given below shows the ratio of poduction to sales of two bike-manufacturing firms over the period of 6 years.
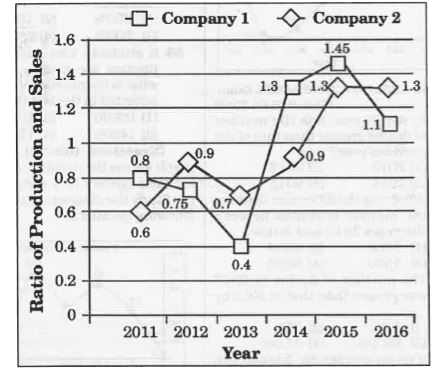
Assume if in any year sales is more than production then both the companies have sufficient stock to meet such instances.
The production of company 1 in year 2014 is 18000 and sales of comapny 2 in year 2012 is 15000. What is the ratio of difference in sales and production of company 1 in year 2014 and that of company 2 in year 2012?
View SolutionThe line chart given below shows the ratio of production to sales of two bike-manufacturing firms over the period of 6 years.
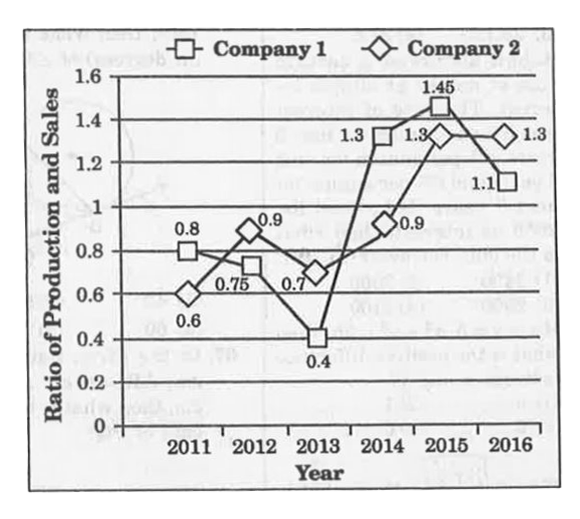
Assume if in any year sales is more than production then both the companies have sufficient stock to meet such instances.
The production of company 2 in year 2012 is 30000. If sales of company 2 in year 2012 and 2013 are same, then what was its production (in units) in year 2013?
View Solution
Knowledge Check
The line chart given below shows the ratio of poduction to sales of two bike-manufacturing firms over the period of 6 years.

Assume if in any year sales is more than production then both the companies have sufficient stock to meet such instances.
The production of company 1 in year 2014 is 18000 and sales of comapny 2 in year 2012 is 15000. What is the ratio of difference in sales and production of company 1 in year 2014 and that of company 2 in year 2012?A8:15B7:16C9:11D3:8The line chart given below shows the ratio of production to sales of two bike-manufacturing firms over the period of 6 years.

Assume if in any year sales is more than production then both the companies have sufficient stock to meet such instances.
The production of company 2 in year 2012 is 30000. If sales of company 2 in year 2012 and 2013 are same, then what was its production (in units) in year 2013?A100000B16000C30000D20000The line chart given below shows the ratio of poduction to sales of two bike-manufacturing firms over the period of 6 years.
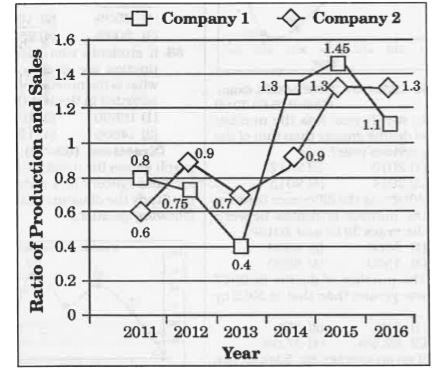
Assume if in any year sales is more than production then both the companies have sufficient stock to meet such instances.
Company 1 sold 20000 bikes each year from 2011 to 2016 and company 2 sold 10000 bikes each year from 2011 to 2016. What is the difference (in units) in average yearly production of companies 1 and 2?A6733.33B7500C8666.66D9333.33
The line chart given below shows the sales (in crores) of a complany for the years 2009 to 2016
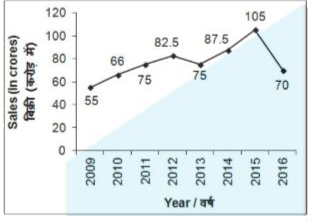
In how many years was the sale of the company more than the sale in 2011?
View SolutionThe line chart given below shows the sales (in crores) of a company for the years 2009 to 2016
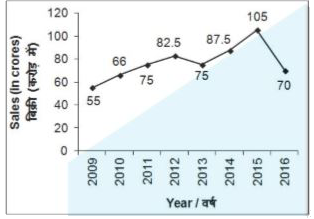
In how many years was the sale of the company a multiple of 10 crores?
View SolutionThe line chart given below shows the sales (in crores) of a company for the years 2009 to 2016
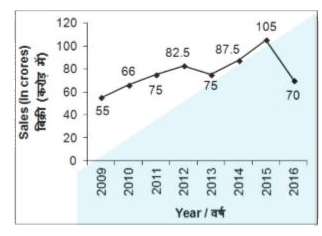
What is the average sale of the company from year 2009 to 2015?
View SolutionThe table given below shows the production (in '000 tonnes) of five companies from 2012 to 2016.

The production of all companies in year 2014 is how much per cent less than the production of all companies in the year 2015?
View SolutionThe table given below shows the production (in '000 tonnes) of five companies from 2012 to 2016.
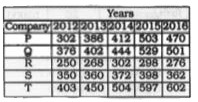
The production of company R in year 2014 is how much per cent more than the production of company R in the year 2013?
View Solution
