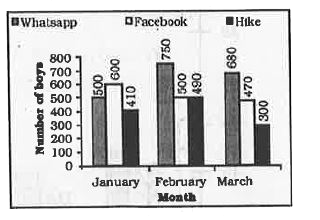
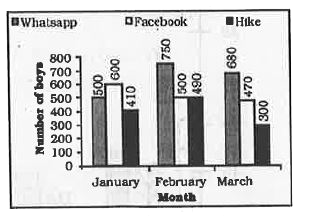
The bar graph given below represents the number of boys in a school using three apps for three months.
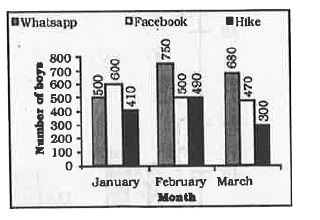
What is the percentage decrease in the number of boys using Facebook from January to February?
26.66
20
21.33
16.66
The correct Answer is:D
Step by step video, text & image solution for The bar graph given below represents the number of boys in a school using three apps for three months. What is the percentage decrease in the number of boys using Facebook from January to February? by Maths experts to help you in doubts & scoring excellent marks in Class 14 exams.
Updated on:21/07/2023Topper's Solved these Questions
- STATISTICS AND DATA INTERPRETATIONBook:KIRAN PUBLICATIONChapter:STATISTICS AND DATA INTERPRETATIONExercise:TYPE-V
Explore 38 Videos
- STATISTICS AND DATA INTERPRETATIONBook:KIRAN PUBLICATIONChapter:STATISTICS AND DATA INTERPRETATIONExercise:TYPE-VI
Explore 86 Videos
- STATISTICS AND DATA INTERPRETATIONBook:KIRAN PUBLICATIONChapter:STATISTICS AND DATA INTERPRETATIONExercise:TYPE-III
Explore 39 Videos
- SIMPLIFICATIONBook:KIRAN PUBLICATIONChapter:SIMPLIFICATIONExercise:TEST YOURSELF
Explore 25 Videos
- TIME AND DISTANCEBook:KIRAN PUBLICATIONChapter:TIME AND DISTANCEExercise:Type -XI
Explore 74 Videos
Similar Questions
The bar graph given below represents the number of boys in a school using three apps for three months.
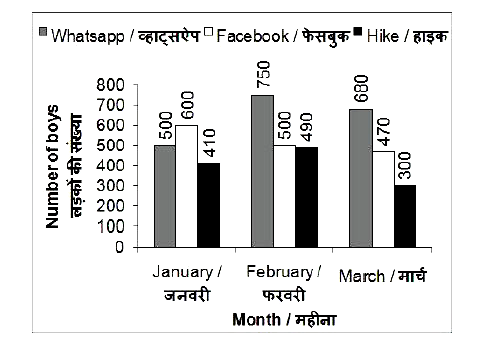
What is the total number of boys using the three apps in month of January?
View SolutionThe bar graph given below represents the number of boys in a school using three apps for three months.
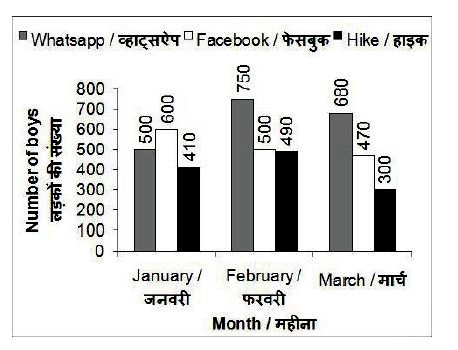
Number of boys using Whatsapp in February is how much percent more than the number of boys using Hike in February?
View Solution
Knowledge Check
The bar graph given below represents the number of boys in a school using three apps for three months.
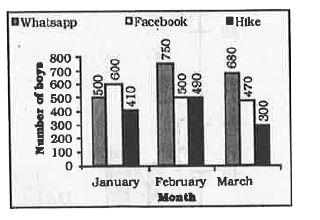
What is the total number of boys using the three apps in the month of March?A1420B1480C1450D1500The bar graph given below represents the number of boys in a school using three apps for three months.
The number of boys using Whatsapp in March is what per cent of the number of boys using Facebook in February?A126.47B136C128D131.3The bar graph given below represents the number of boys in a school using three apps for three months.
The number of boys using Whatsapp in February is how much per cent more than the number of boys using Facebook in February?A50B33.33C66.666D44.22
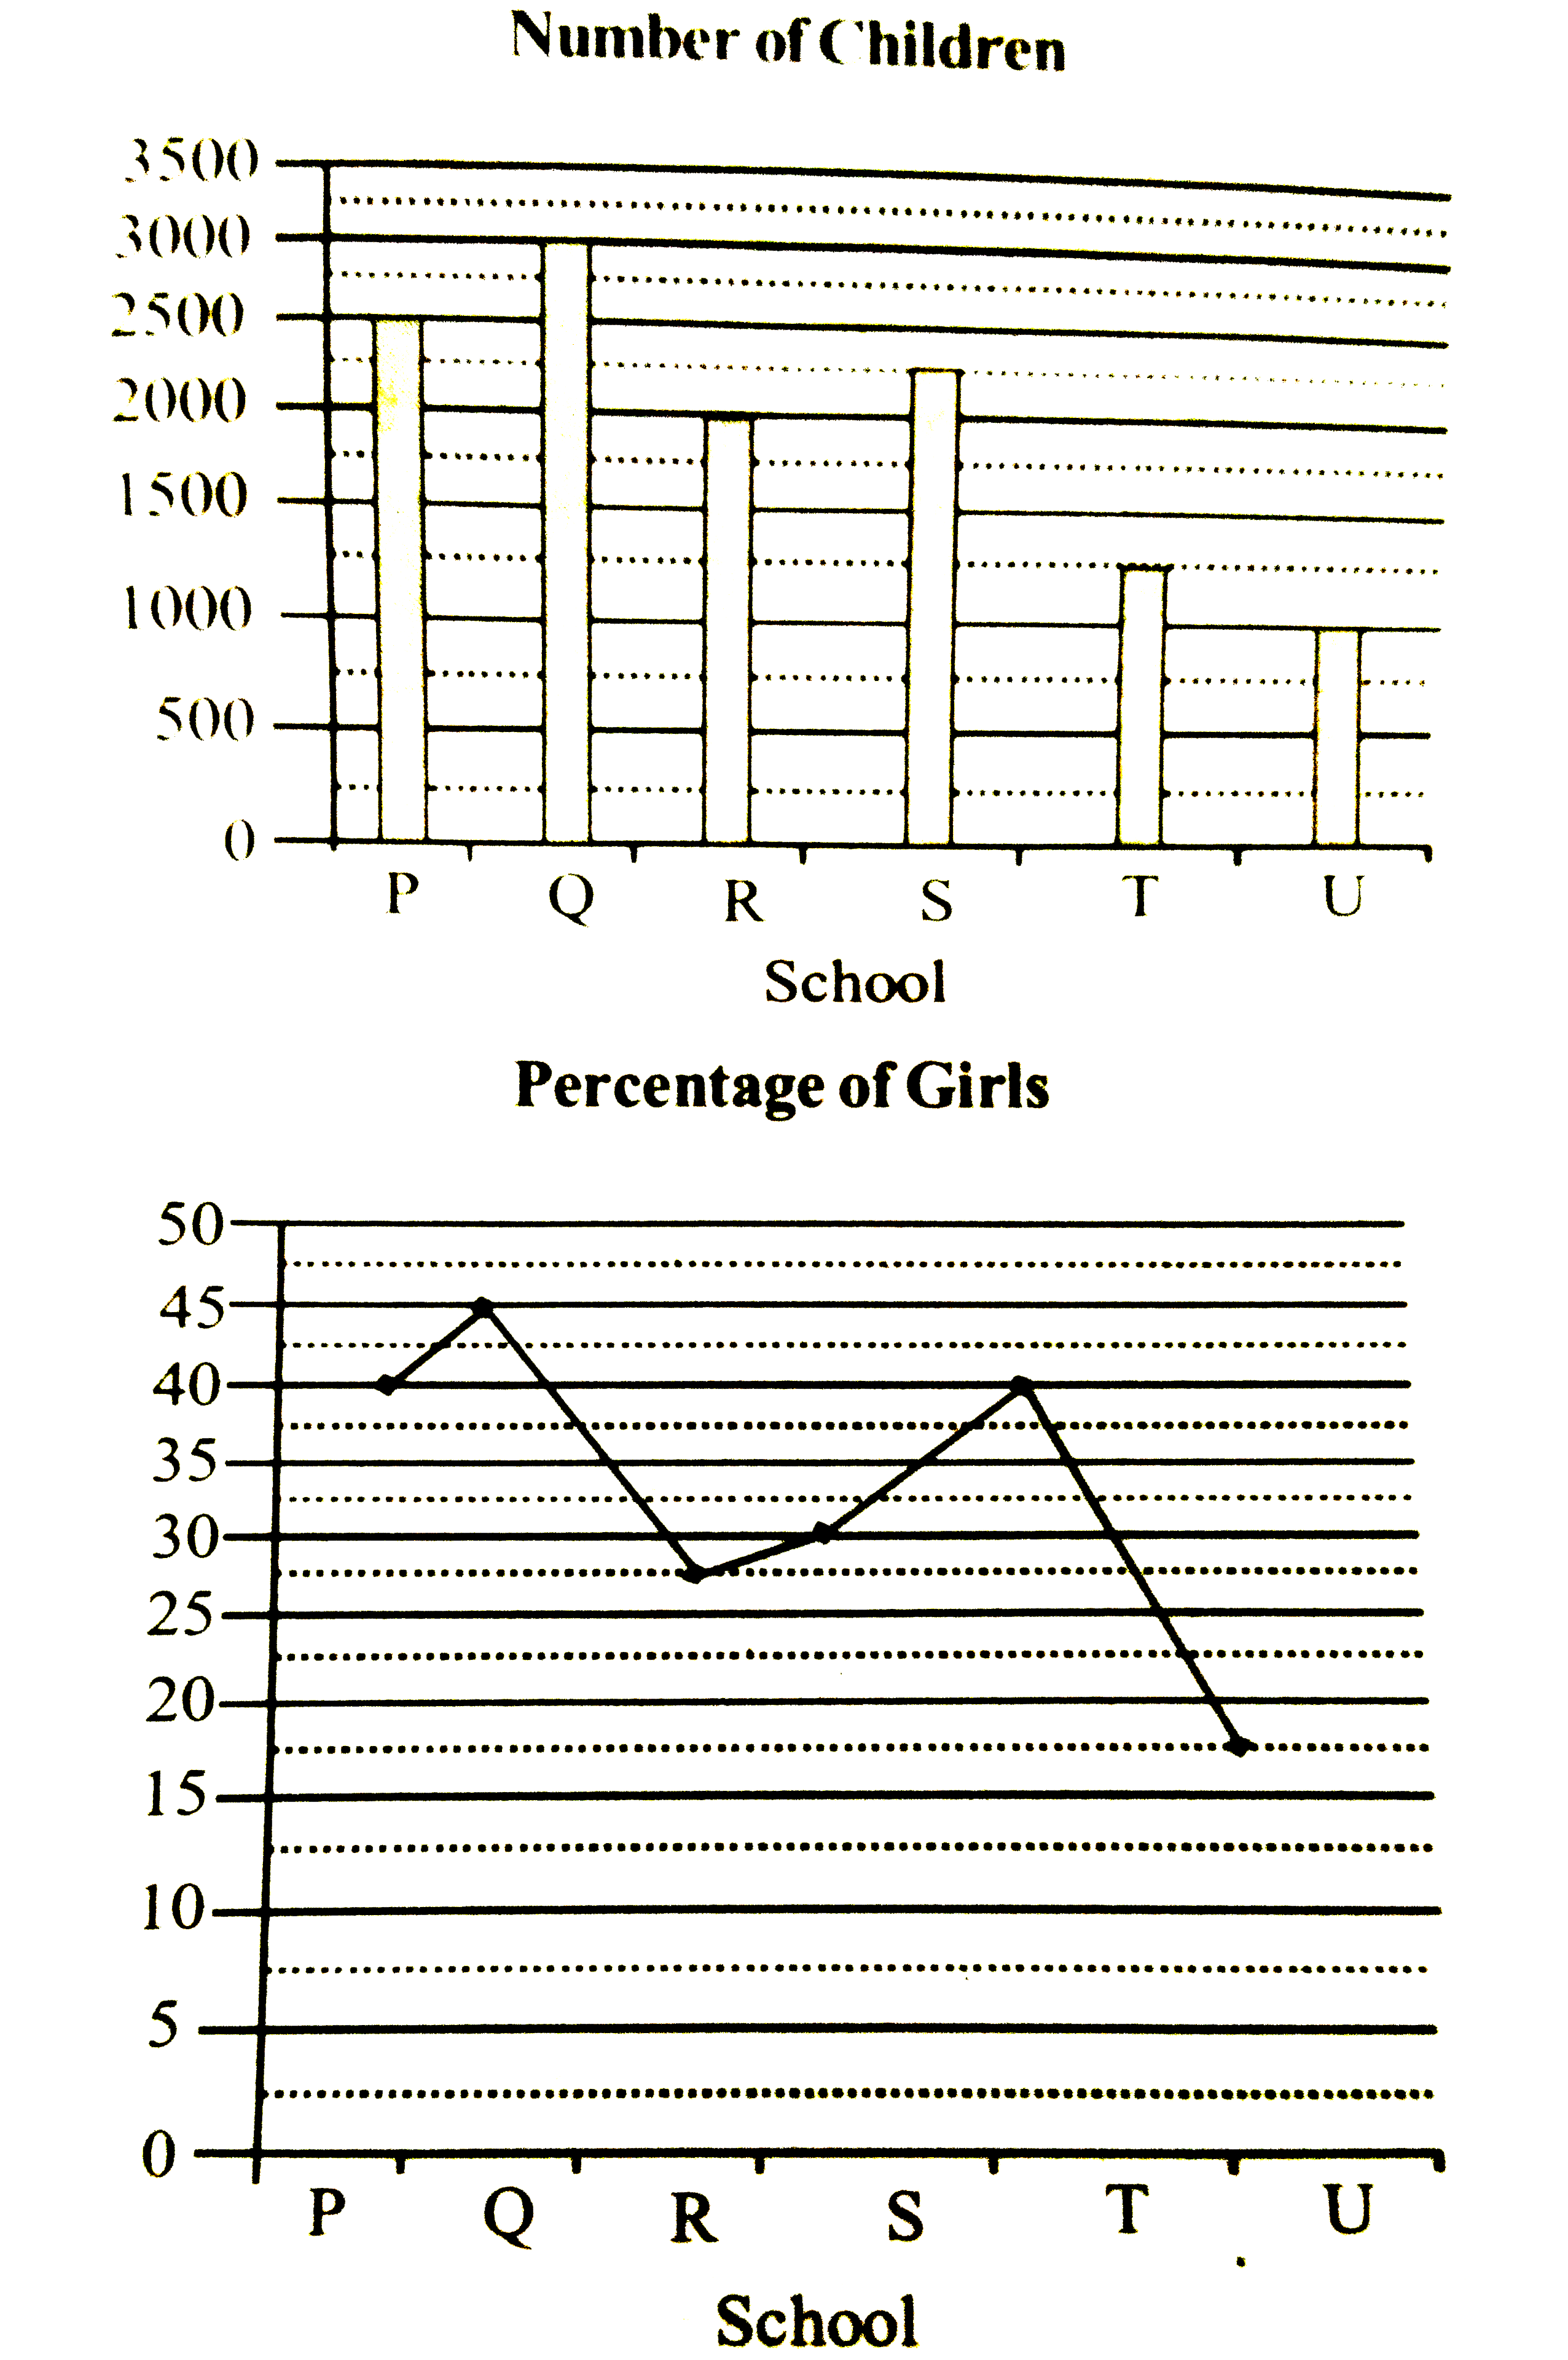
What is the total number of boys in School T ?
View Solution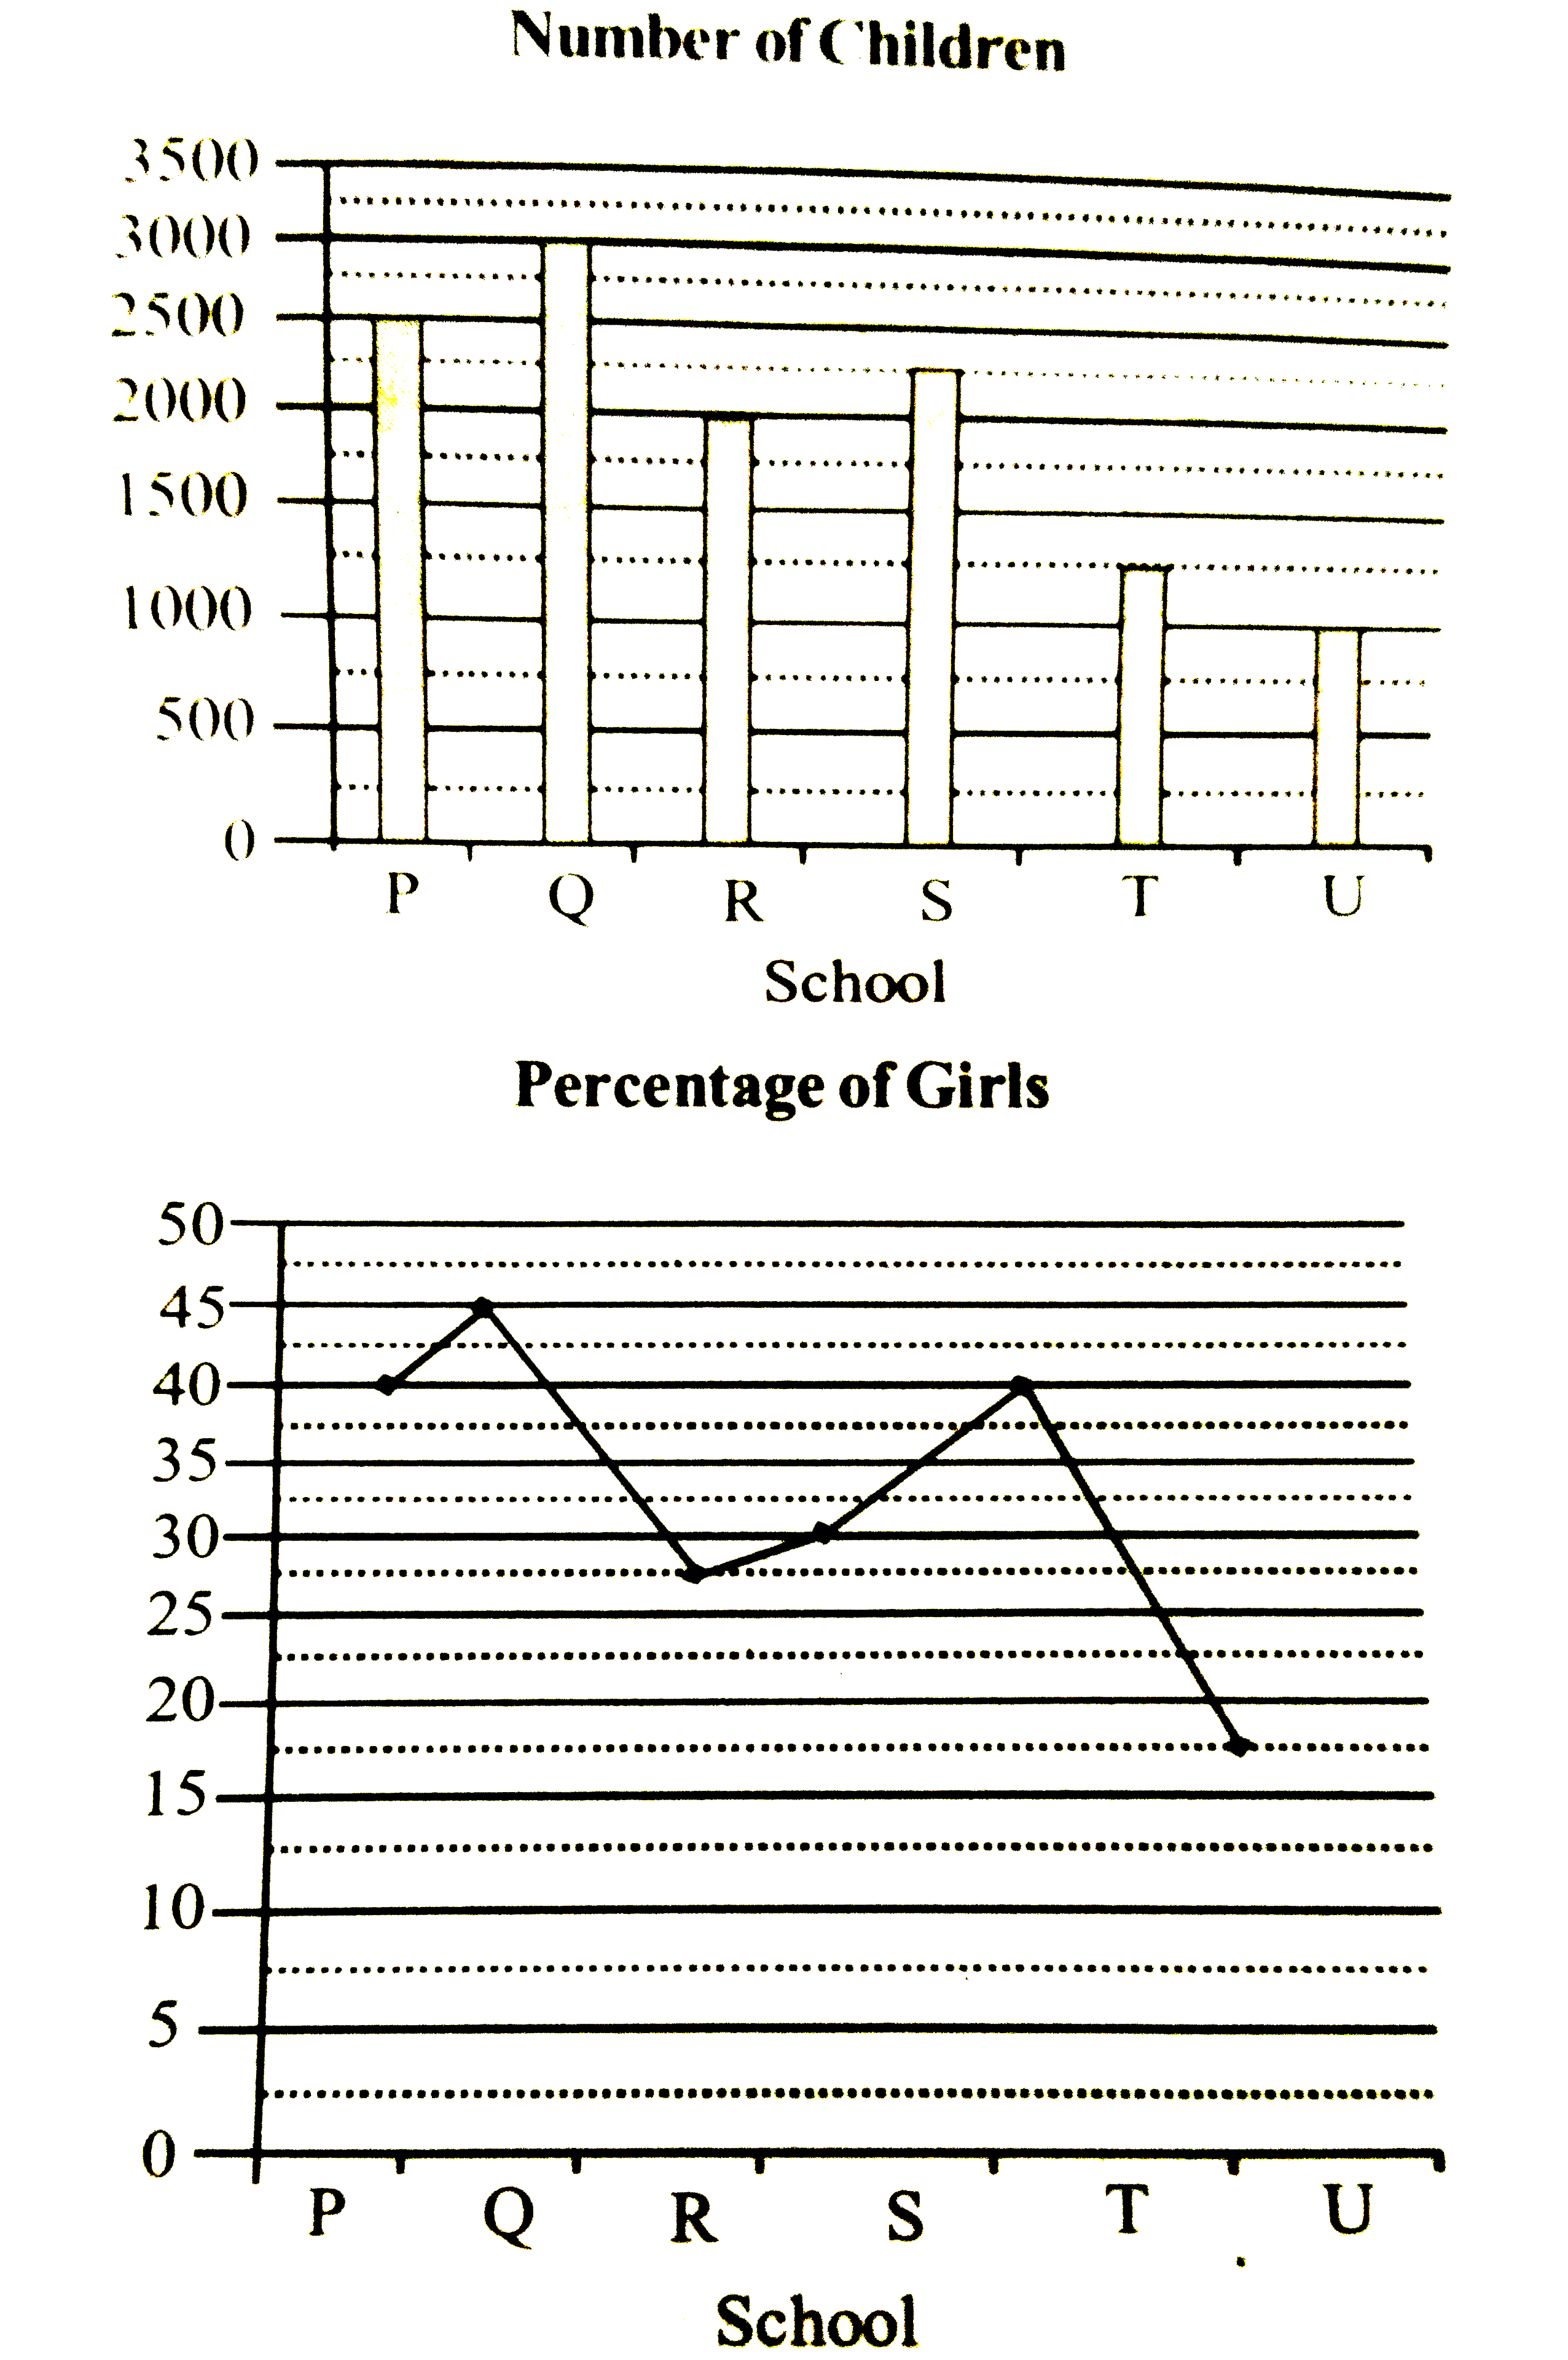
What is the number of boys in school P and Q together ?
View SolutionThe line chart given below represents the sales ( in 00) of trousers and shirts for five months .
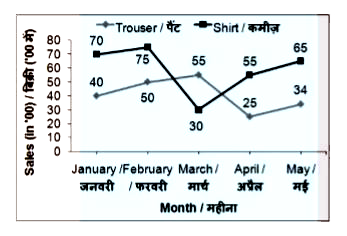
What is the percentage decrease in the sales of the trousers from February to March?
View SolutionThe given data shows the number of boys in classes V to X of a school.
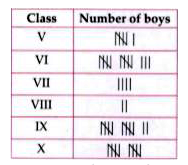
What is the difference between the number of boys in class VI and class IX?
View SolutionThe line chart given blow represents the sales (in 00) of trousers ans shirts for five months.
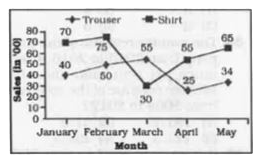
What is the percentage increase in the sales of the trousers from January to February?
View Solution
