Study the following graph which shows the production (in thousand) of different items, and answer the questions.
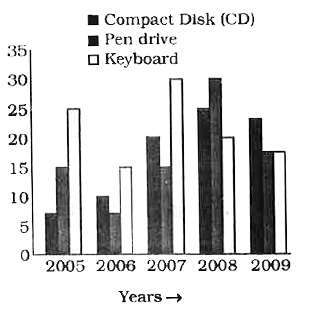
The total number of all products produced by the company in the year 2006 and 2008 together is
107500
105700
10750
1075
The correct Answer is:A
Step by step video, text & image solution for Study the following graph which shows the production (in thousand) of different items, and answer the questions. The total number of all products produced by the company in the year 2006 and 2008 together is by Maths experts to help you in doubts & scoring excellent marks in Class 14 exams.
Updated on:21/07/2023Topper's Solved these Questions
- STATISTICS AND DATA INTERPRETATIONBOOK - KIRAN PUBLICATIONCHAPTER - STATISTICS AND DATA INTERPRETATIONEXERCISE - TYPE-V
38 Videos
- STATISTICS AND DATA INTERPRETATIONBOOK - KIRAN PUBLICATIONCHAPTER - STATISTICS AND DATA INTERPRETATIONEXERCISE - TYPE-VI
86 Videos
- STATISTICS AND DATA INTERPRETATIONBOOK - KIRAN PUBLICATIONCHAPTER - STATISTICS AND DATA INTERPRETATIONEXERCISE - TYPE-III
39 Videos
- SIMPLIFICATIONBOOK - KIRAN PUBLICATIONCHAPTER - SIMPLIFICATIONEXERCISE - TEST YOURSELF
25 Videos
- TIME AND DISTANCEBOOK - KIRAN PUBLICATIONCHAPTER - TIME AND DISTANCEEXERCISE - Type -XI
74 Videos
Similar Questions
Study the following graph which shows the production (in thousands) of different items, and answer these questions.
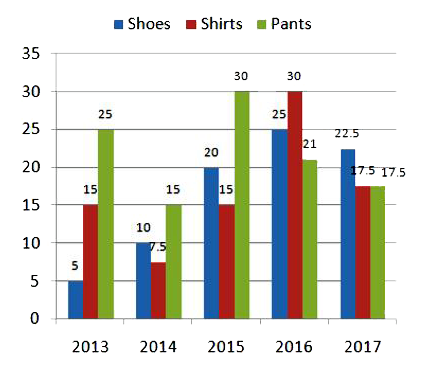
The total number of all products produced by the company in the year 2014 and 2016 together is:
View SolutionStudy the following graph which shows the production (in thousands)of different items, and answer these questions.
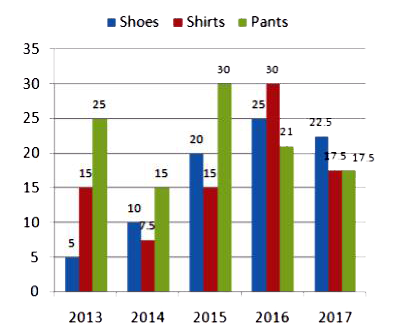
The ratio between the number of pants produced by the company in the year 2014, 2015 and 2016 respectively is:
View Solution
Knowledge Check
Study the following graph which shows the production (in thousand) of different items, and answer the questions.
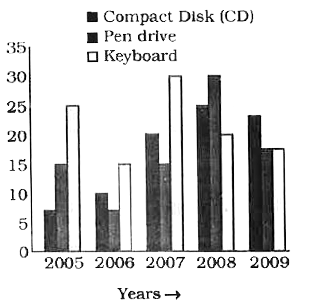
The ratio between the number of keyboards produced by the company in the year 2006, 2007 and 2008 respectively isA1:2:3B3:4:5C3:6:4D3:4:6Study the following graph which shows the production (in thousand) of different items, and answer the questions.
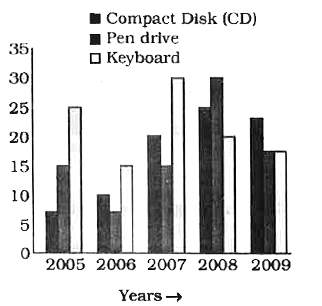
The respective ratio between the number of CDs produced by the company in the year 2009 and the number of kerbords produced by the company in the year 2005 isA9:10B11:10C10:9D1:1Study the following graph which shows the production (in thousand) of different items, and answer the questions.
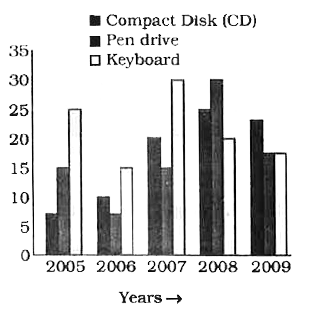
The average number of pendrives produced by the company over all the years together isA17B170000C17000D85000
Study the following graph which shows the production (in thousands)of different items, and answer these questions
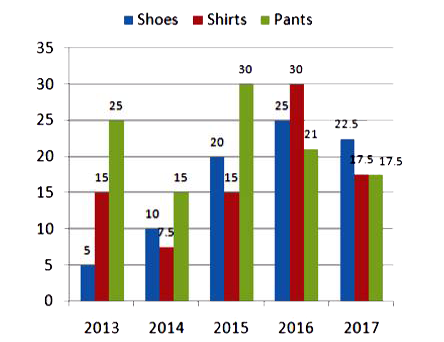
The difference between the total number of Shoes and Shirts produced by the company in the year 2016 and the number of Pants produced by the company in the year 2014 is:
View SolutionStudy the following table, (which shows the number of units of an item manufactured and sold by 5 companies) and answer the question
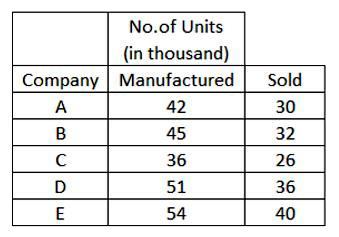
The ratio of the number of units manufactured by companies C and E together and the number of units sold by A and D together is?
View SolutionStudy the following graph which shows the production (in thousand) of different items, and answer the questions.
निम्नलिखित ग्राफ का अध्ययन कीजिए, जिन विभिन्न मदों का उत्पादन (हजार में) दर्शाया गया है तथा दिए गए प्रश्नों के उत्तर दीजिए।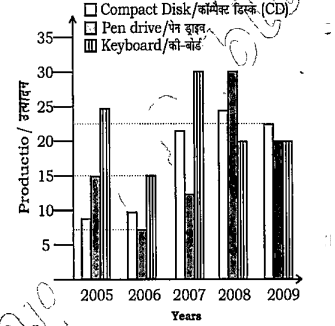 The total number of all products produced by the company in the year 2006 and 2008 together is:-
कंपनी द्वारा वर्ष 2006 और 2008 में तेयार सभी उत्पादों को मिलाकर उनकी कुल संख्या कितनी है?
View SolutionStudy the following graph which shows the production (in thousand) of different items, and answer the questions.
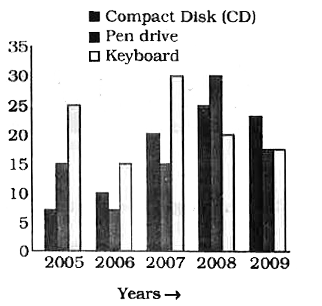
The difference between the tota number of CD and pen-drives produced by the company together in the year 2008 and the number of keyboards produced by the company in the year 2006 is
View SolutionStudy the following graph carefully to answer these questions-
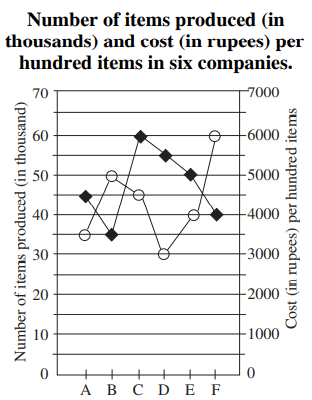
What is the total cost of items produced by companies A and B together?
View Solution
