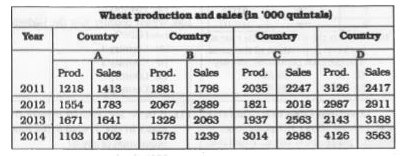
The table given below represents the production and sales of wheat in 4 different countries A, B, C and D over a period of 4 years. At the end of year 2010 A, B, C and D had a stock of 5200, 3500, 7835 and 1956 (in '000 quintals) of wheat respectively. For any given year, the stock of wheat is calculated as :
Stock of year (n + 1) = stock at end of year (n) + production in year (n + 1) - sales in year (n + 1)
And Surplus or year (n) = production in year (n) - sales in year (n)
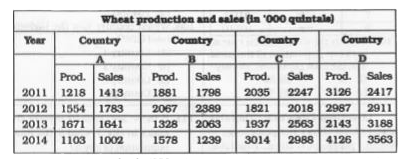
What is the surplus (in '000 quintals) of country A of years 2013 and 2014 taken together?
122
131
143
158
The correct Answer is:B
Step by step video, text & image solution for The table given below represents the production and sales of wheat in 4 different countries A, B, C and D over a period of 4 years. At the end of year 2010 A, B, C and D had a stock of 5200, 3500, 7835 and 1956 (in '000 quintals) of wheat respectively. For any given year, the stock of wheat is calculated as : Stock of year (n + 1) = stock at end of year (n) + production in year (n + 1) - sales in year (n + 1) And Surplus or year (n) = production in year (n) - sales in year (n) What is the surplus (in '000 quintals) of country A of years 2013 and 2014 taken together? by Maths experts to help you in doubts & scoring excellent marks in Class 14 exams.
Updated on:21/07/2023Topper's Solved these Questions
- STATISTICS AND DATA INTERPRETATIONBOOK - KIRAN PUBLICATIONCHAPTER - STATISTICS AND DATA INTERPRETATIONEXERCISE - TYPE-II
131 Videos
- STATISTICS AND DATA INTERPRETATIONBOOK - KIRAN PUBLICATIONCHAPTER - STATISTICS AND DATA INTERPRETATIONEXERCISE - TYPE-III
39 Videos
- SIMPLIFICATIONBOOK - KIRAN PUBLICATIONCHAPTER - SIMPLIFICATIONEXERCISE - TEST YOURSELF
25 Videos
- TIME AND DISTANCEBOOK - KIRAN PUBLICATIONCHAPTER - TIME AND DISTANCEEXERCISE - Type -XI
74 Videos
Similar Questions
Knowledge Check
The table given below represents the production and sales of wheat in 4 different countries A, B, C and D over a period of 4 years. At the end of year 2010 A, B, C and D had a stock of 5200, 3500, 7835 and 1956 (in '000 quintals) of wheat respectively. For any given year, the stock of wheat is calculated as :
Stock of year (n + 1) = stock at end of year (n) + production in year (n + 1) - sales in year (n + 1)
And Surplus or year (n) = production in year (n) - sales in year (n)
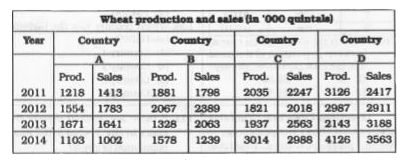
What is the stock (in '000 quintals) of country C at end of the four year period?A5926B6213C6826D8844The table given below represents the production and sales of wheat in 4 different countries A, B, C and D over a period of 4 years. At the end of year 2010 A, B, C and D had a stock of 5200, 3500, 7835 and 1956 (in '000 quintals) of wheat respectively. For any given year, the stock of wheat is calculated as :
Stock of year (n + 1) = stock at end of year (n) + production in year (n + 1) - sales in year (n + 1)
And Surplus or year (n) = production in year (n) - sales in year (n)
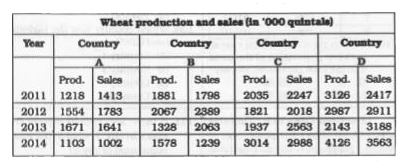
What can be said about total surplus of country B and country D over the 4 years?ASurplus of B = Surplus of DBSurplus of D > Surplus of BCSurplus of B > Surplus of DDNo relation is thereThe table given below represents the production and sales of wheat in 4 different countries A, B, C and D over a period of 4 years. At the end of year 2010 A, B, C and D had a stock of 5200, 3500, 7835 and 1956 (in '000 quintals) of wheat respectively. For any given year, the stock of wheat is calculated as :
Stock of year (n + 1) = stock at end of year (n) + production in year (n + 1) - sales in year (n + 1)
And Surplus or year (n) = production in year (n) - sales in year (n)
What is the difference between (in '000 quintals) in average production and average sales respectively country C in the given four years?A-252.25B-415.5C350.75D275.25
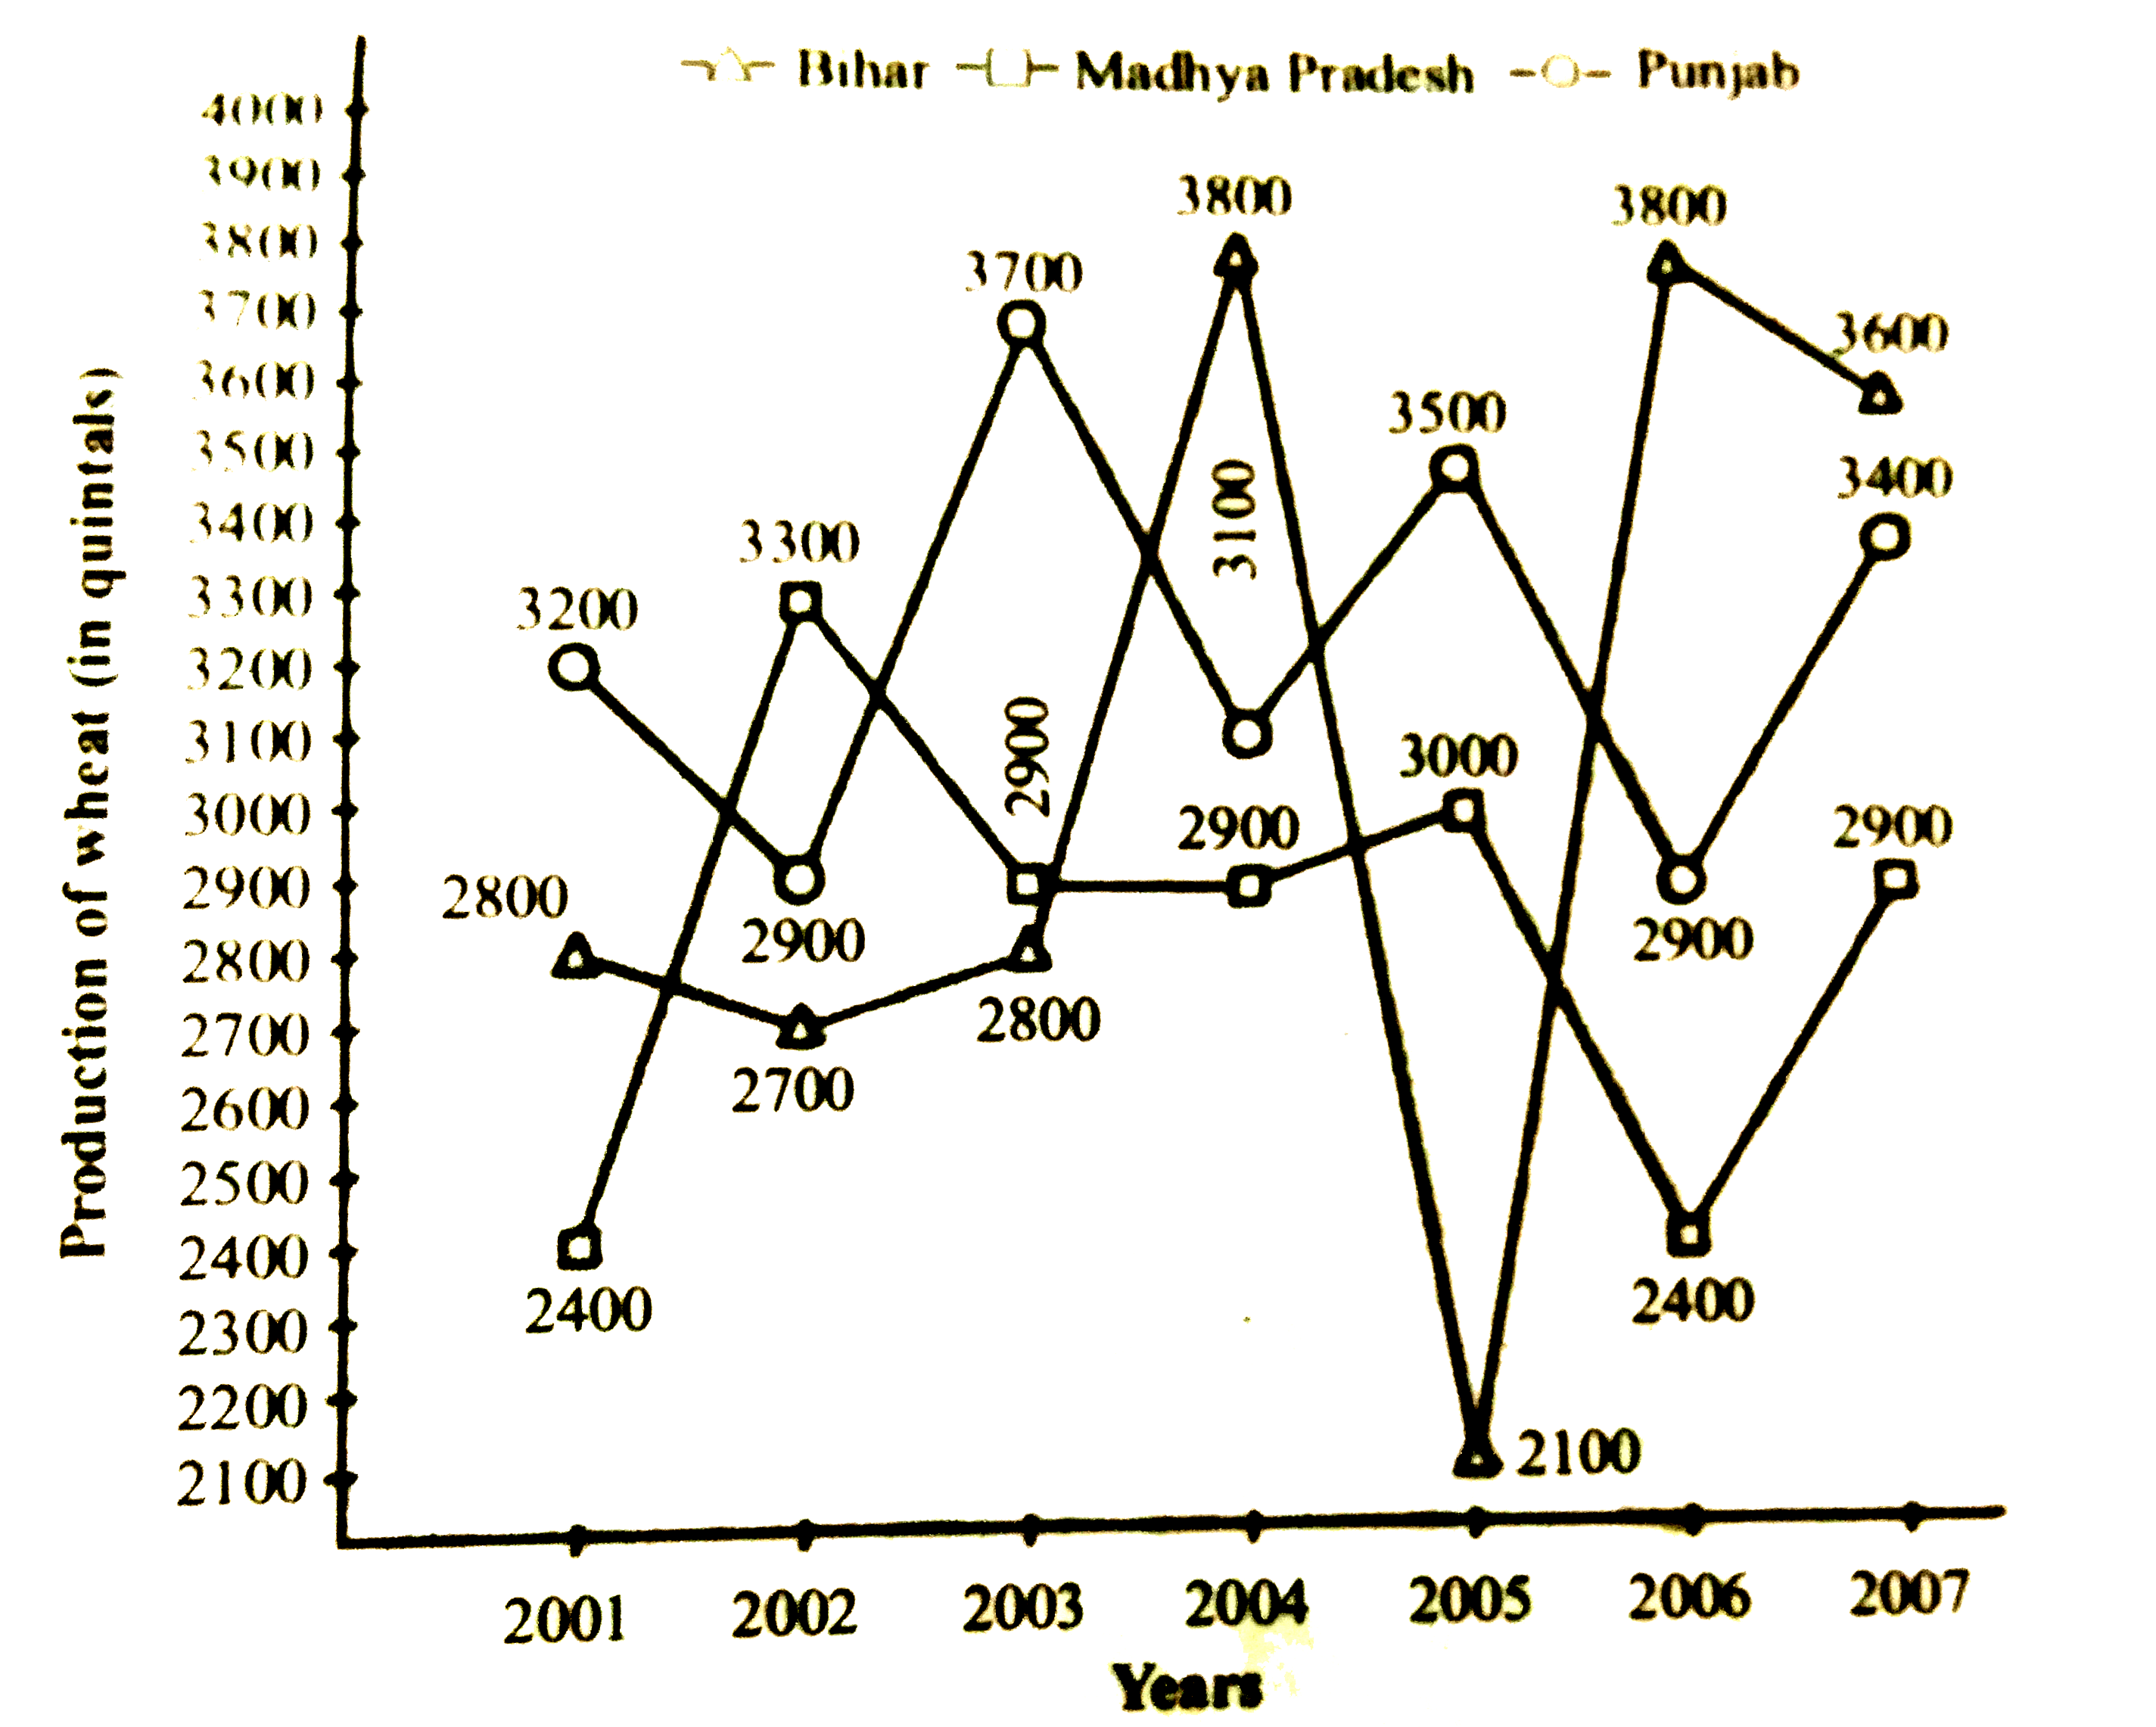
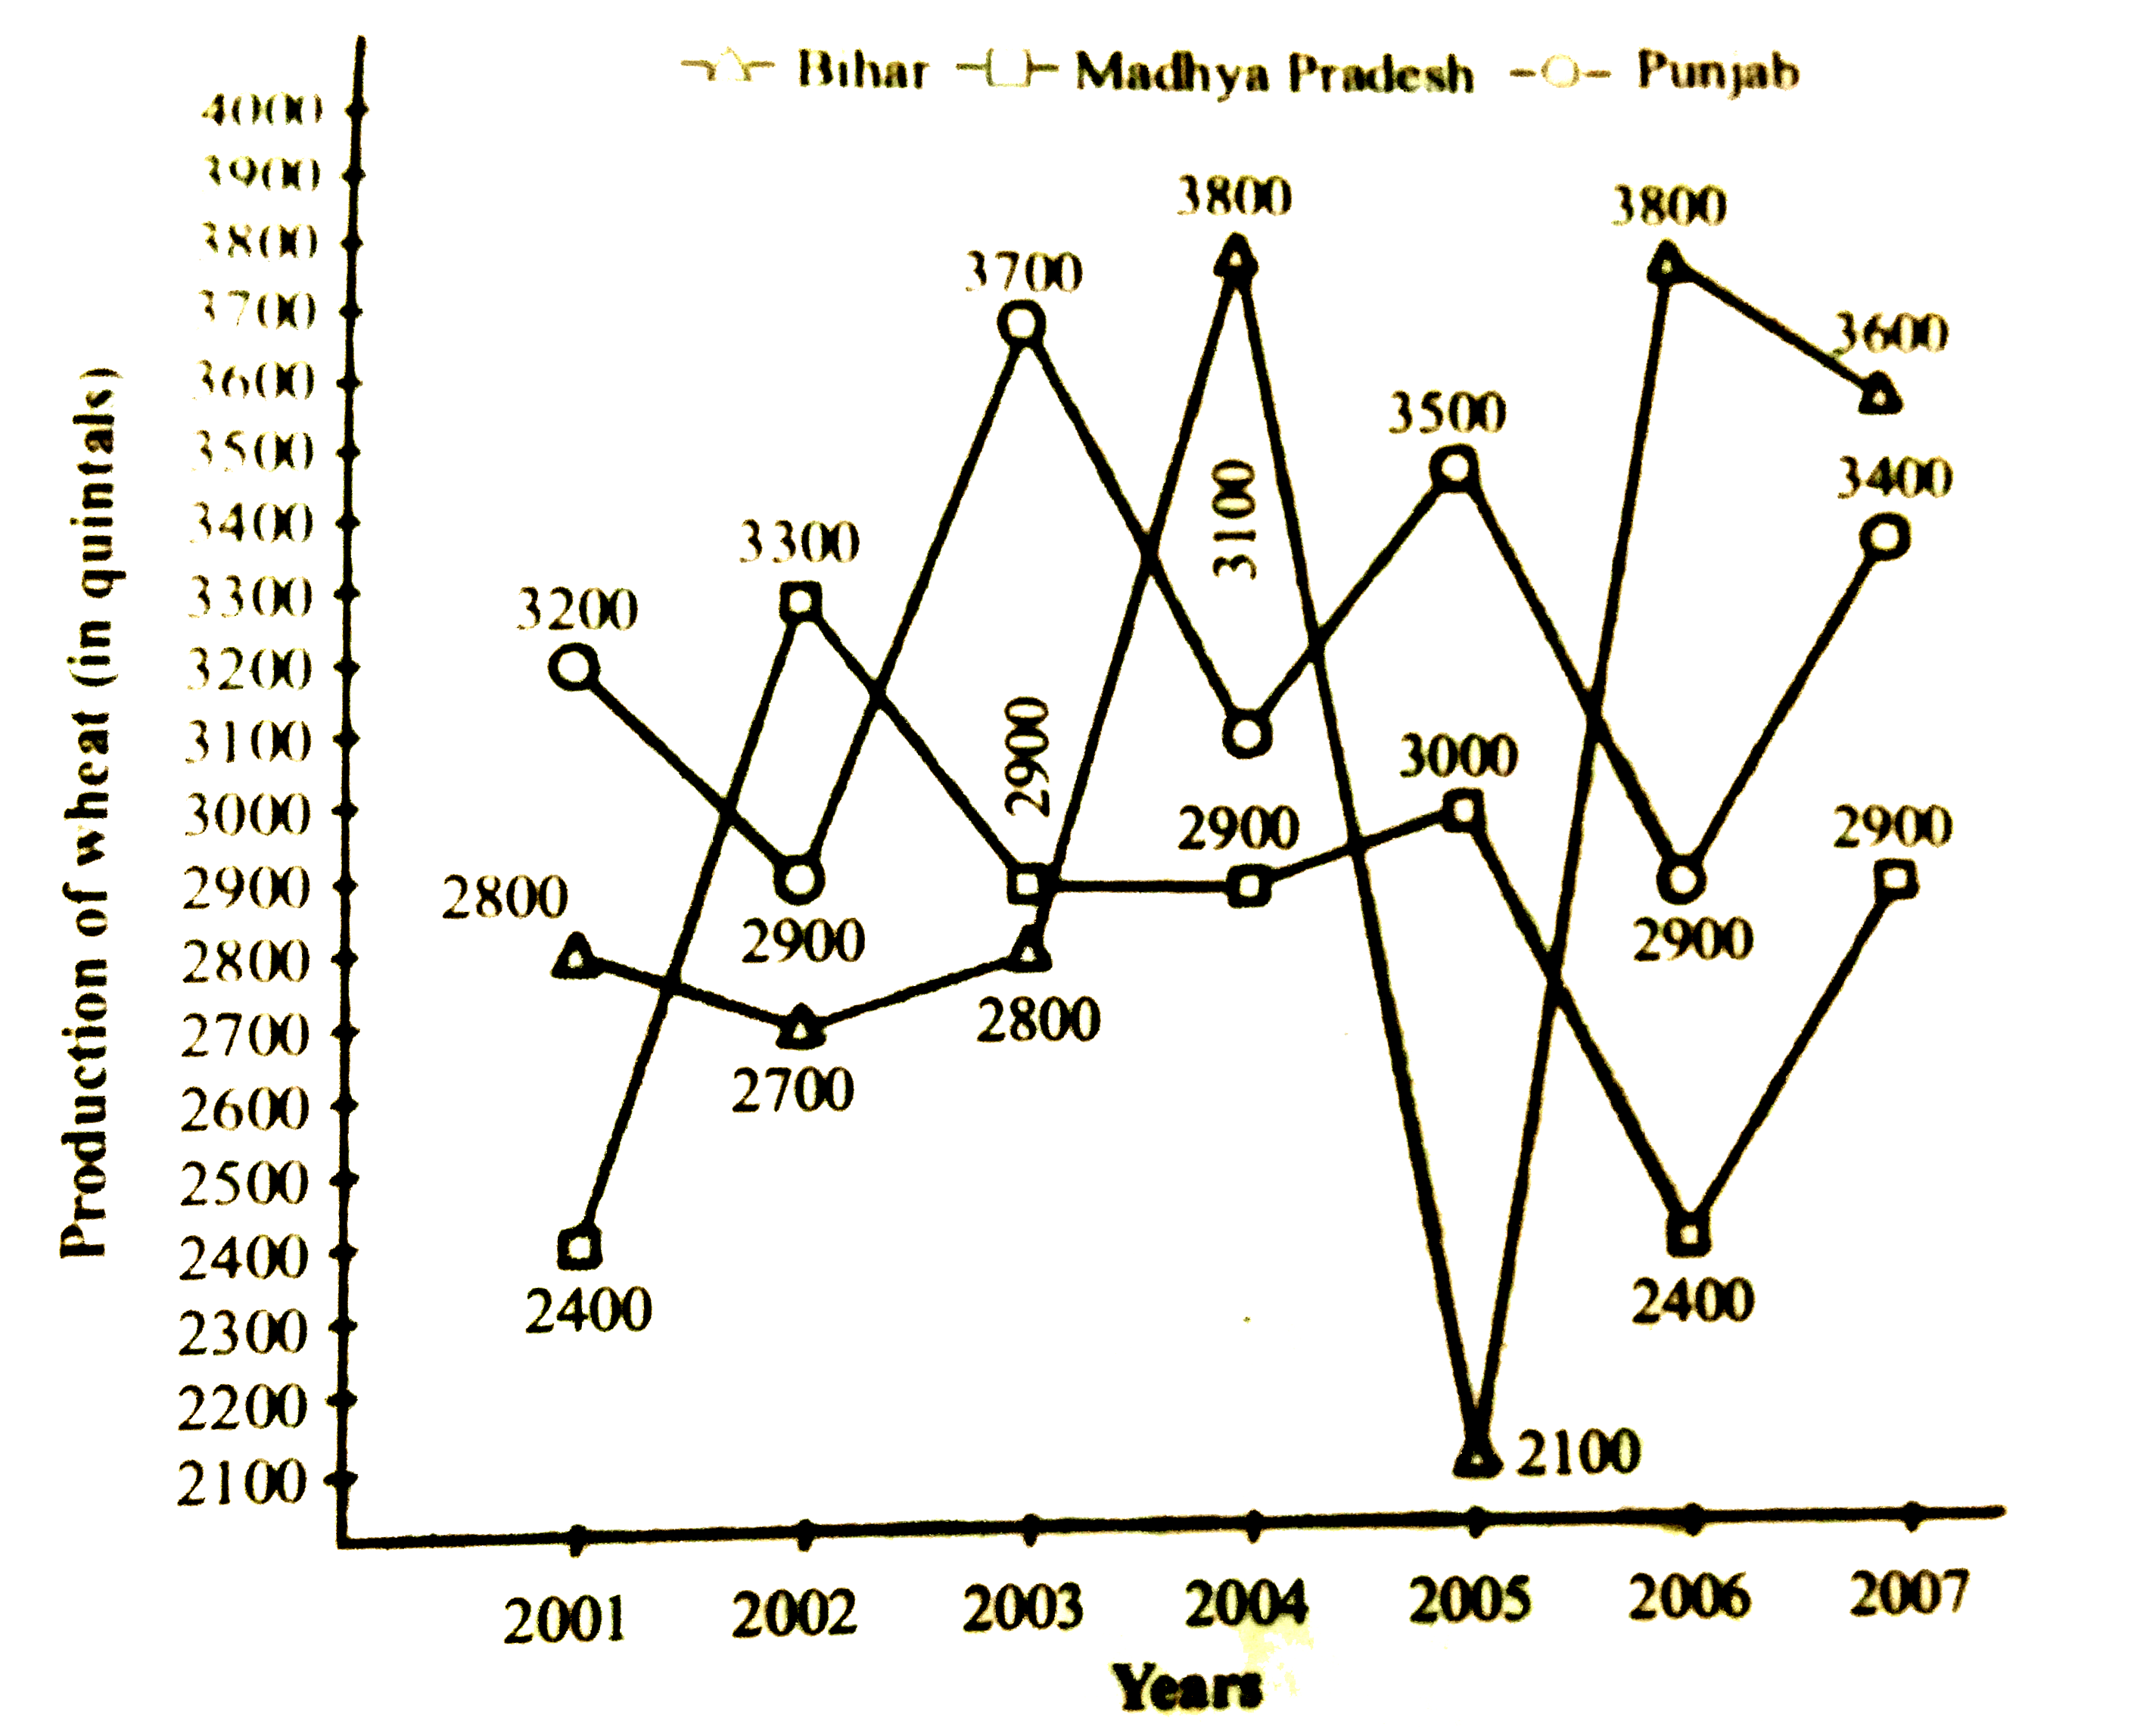
What was the total production of wheat by these three states in the year 2007 ? ( in quintals)
View SolutionThe given table represents the exports (in Rs. Crores) of four items A, B, C and D over a period of six years. Study the table and answer the question that follows.
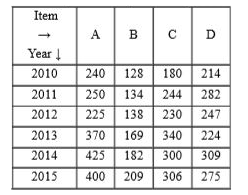
In which year, the exports of item D were 1.4 times the average exports of item B during six years?
View SolutionThe table given below shows the revenue (in crores) of a company from years 2010 to 2016)
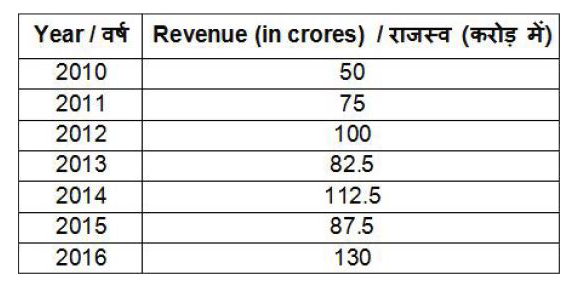
In how many years, the revenue was more than that in year 2013?
View SolutionThe table given below shows the revenue (in crores) of a company from years 2010 to 2016)
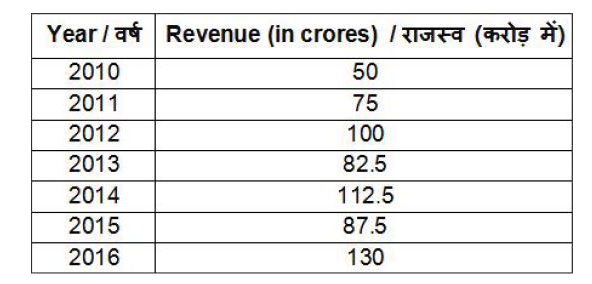
What is the percentage change in the revenue from year 2010 to 2014?
View SolutionThe table shows the production of different types of cars (in thousands).
यह तालिका अलग-अलग प्रकार के कारों का उत्पादन ( हज़ार में) दर्शाती है |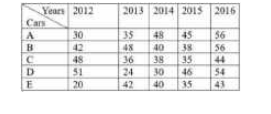 The number of years, in which the production of cars of type B is less than the average production of type D cars over the years is:
कितने वर्ष B प्रकार की कारों का उत्पादन इन वर्षों के दौरान D प्रकार की कारों के औसत उत्पादन से कम रहा है ?
View Solution

