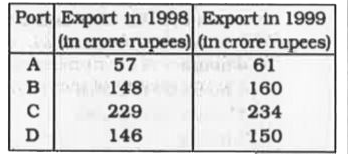
The table given below depicts the export of a commodity through four ports in the years 1998 and 1999.
Study the table and answer the questions.

What was the average increase in the export of the commodity from the ports in the year 1999 as compared to the year 1998 ?
Rs 82500000
Rs 80000000
Rs 75000000
Rs 62500000
The correct Answer is:D
Step by step video, text & image solution for The table given below depicts the export of a commodity through four ports in the years 1998 and 1999. Study the table and answer the questions. What was the average increase in the export of the commodity from the ports in the year 1999 as compared to the year 1998 ? by Maths experts to help you in doubts & scoring excellent marks in Class 14 exams.
Updated on:21/07/2023Topper's Solved these Questions
- STATISTICS AND DATA INTERPRETATIONBOOK - KIRAN PUBLICATIONCHAPTER - STATISTICS AND DATA INTERPRETATIONEXERCISE - TYPE-II
131 Videos
- STATISTICS AND DATA INTERPRETATIONBOOK - KIRAN PUBLICATIONCHAPTER - STATISTICS AND DATA INTERPRETATIONEXERCISE - TYPE-III
39 Videos
- SIMPLIFICATIONBOOK - KIRAN PUBLICATIONCHAPTER - SIMPLIFICATIONEXERCISE - TEST YOURSELF
25 Videos
- TIME AND DISTANCEBOOK - KIRAN PUBLICATIONCHAPTER - TIME AND DISTANCEEXERCISE - Type -XI
74 Videos
Similar Questions
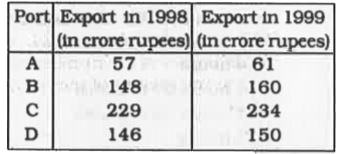
The table given below depicts the export of a commodity through four ports in the years 1998 and 1999.
Study the table and answer the questions.

What was the change in the aggregate export of the commodity in the year 1999 as compared to the year 1998 ?
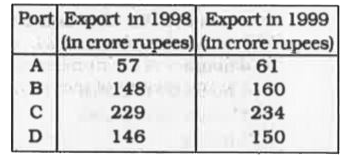
View SolutionThe table given below depicts the export of a commodity through four ports in the years 1998 and 1999 .
Study the table and answer the questions

The percentage increase in the export of the commodity from the year 1998 to 1999 was the highest from which port ?
View Solution
Knowledge Check
Study the following table and answer the questions based on it.What was the average increase in the export of the commodity from the ports in the year 1999 as compared the year 1998?
A?82500000B?80000000C?75000000D?62500000The table given below depicts the export of a commodity through four ports in the years 1998 and 1999 .
Study the table and answer the questions

What was the change in the aggregate export of the commodity in the year 1999 as compared to the year 1998 ?ANearly 4.3 % increaseBNearly 4.3 % decreaseCNearly 0.04 % increaseDNearly 0.04 % decreaseThe table given below depicts the export of a commodity through four ports in the years 1998 and 1999.
Study the table and answer the questions.

The percentage increase in the export of the commodity from the year 1998 to 1999 was the lowest from which port ?AABBCCDD
The table given below depicts the export of a commodity through four ports in the years 1998 and 1999 .
Study the table and answer the questions

The percentage increase in the export of the commodity from the year 1998 to 1999 was the lowest from which port ?
View SolutionStudy the following table and answer the questions based on it.The percentage increase in the export of the commodity from the year 1998 to 1999 was the highest from which port?
View SolutionStudy the following table and answer the questions based on it.What was the change in the aggregate export of the commodity in theyear 1999 as compared to the year 1998?
View SolutionStudy the following table and answer the questions based on it.The percentage increase in the export of the commodity from the year 1998 to 1999 was the lowest from which port?
View SolutionStudy the following table and answer the questions based on it.The percentage increase in the export of the commodity from the year 1998 to 1999 was the highest from which port?
View Solution
