The table given here shows production of five types of cars by a company in the year 1989 to 1994. Study the table and answer questions
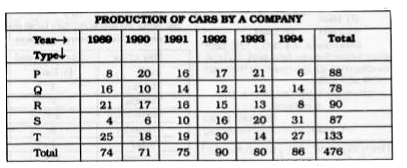
The percent increased in total production of all types of cars in 1992 to that in 1991 was :
15%
20%
25%
30%
The correct Answer is:B
Step by step video, text & image solution for The table given here shows production of five types of cars by a company in the year 1989 to 1994. Study the table and answer questions The percent increased in total production of all types of cars in 1992 to that in 1991 was : by Maths experts to help you in doubts & scoring excellent marks in Class 14 exams.
Updated on:21/07/2023Topper's Solved these Questions
- STATISTICS AND DATA INTERPRETATIONBOOK - KIRAN PUBLICATIONCHAPTER - STATISTICS AND DATA INTERPRETATIONEXERCISE - TYPE-II
131 Videos
- STATISTICS AND DATA INTERPRETATIONBOOK - KIRAN PUBLICATIONCHAPTER - STATISTICS AND DATA INTERPRETATIONEXERCISE - TYPE-III
39 Videos
- SIMPLIFICATIONBOOK - KIRAN PUBLICATIONCHAPTER - SIMPLIFICATIONEXERCISE - TEST YOURSELF
25 Videos
- TIME AND DISTANCEBOOK - KIRAN PUBLICATIONCHAPTER - TIME AND DISTANCEEXERCISE - Type -XI
74 Videos
Similar Questions
The table given below shows production of five types of cars by a company from the 1998 to 2003. Study the table and answer the questions.
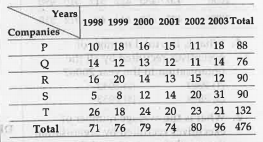
Which company produced the highest number of cars in all the years together?
View SolutionThe table given below shows production of five types of cars by a company from the 1998 to 2003. Study the table and answer the questions.
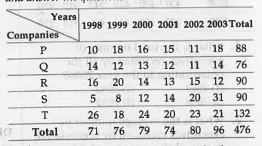
What is the ratio of total number of cars produced by all the companies together in the years 2003 and 1999?
View Solution
Knowledge Check
The per cent increase in total production of all types of cars in 1992 to that in 1991 was
A15B20C25D30The table given here shows production of five types of cars by a company in the year 1989 to 1994. Study the table and answer questions
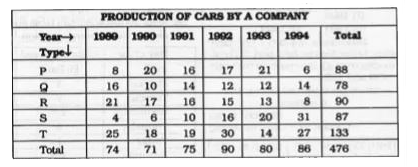
The production of which type of car was 25% of the total production of all types of cars during 1993?ASBRCQDPThe table given here shows production of five types of cars by a company in the year 1989 to 1994. Study the table and answer questions
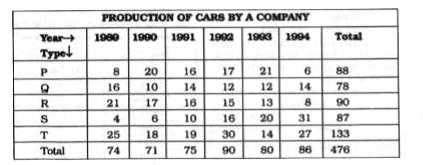
In which year the production of cars of types P and Q together was equal to the total production of cars of types R and S together?A1990B1991C1994DNone of the above
The table given here shows production of five types of cars by a company in the year 1989 to 1994. Study the table and answer questions
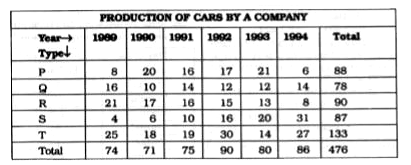
In which year the production of cars of all types taken together was approximately equal to the average of the total production during the period?
View SolutionThe table given here shows production of five types of cars by a company in the year 1989 to 1994. Study the table and answer questions
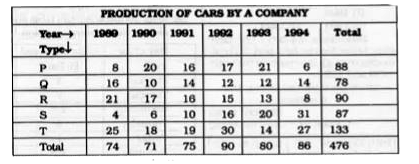
During the period 1989-94, in which type of cars was a continuous increase in production?
View SolutionThe table given below shows production of five types of cars by a company from the year 1998 to 2003. Study the table and answer the equation.
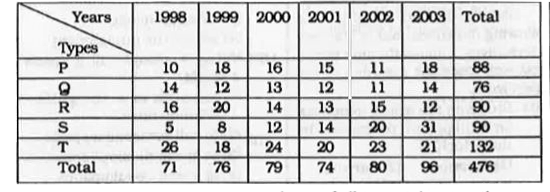
In which year the production of cars of all types taken together was approximately equal to the average of the total production during the period :
View SolutionThe table shows the production of different types of cars by a company (in thousands) in 5 years. Study the table and answer the questions.
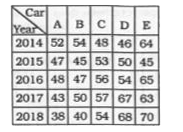
What is the ratio of the total production of type C cars in 2015 and type D cars in 2017 taken together to the total production of type B cars in 2016 and type A cars in 2017 taken together ?
View SolutionThe time table below shows production of five types of cars by a company from the year 1998 to 2003. Study the table and answer the question.
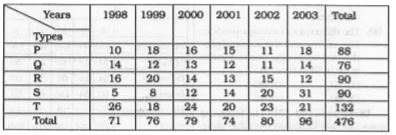
In which year the production of cars of all types taken together was approximately equal to the average of the total production during the period:
View Solution
