In an examination, 40% of candidates got second class. When the data are represented by a pie chart, what is the angle corresponding to second class?
(a)40∘
(b)90∘
(c)144∘
(d)320∘
40∘
90∘
144∘
320∘
The correct Answer is:C
To find the angle corresponding to the second class in a pie chart, we can follow these steps:
1. Understand the Total Angle of a Pie Chart:
The total angle in a pie chart is 360 degrees, which represents 100% of the data.
2. Calculate the Angle for 1%:
To find the angle corresponding to 1%, we divide the total angle by 100:
Angle for 1%=360∘100=3.6∘
3. Calculate the Angle for 40%:
Since 40% of the candidates got second class, we multiply the angle for 1% by 40:
Angle for 40%=40×3.6∘=144∘
4. Conclusion:
The angle corresponding to the second class in the pie chart is 144∘.
Final Answer:
The angle corresponding to second class is (c) 144∘.
---
The total angle in a pie chart is 360 degrees, which represents 100% of the data.
To find the angle corresponding to 1%, we divide the total angle by 100:
Angle for 1%=360∘100=3.6∘
Since 40% of the candidates got second class, we multiply the angle for 1% by 40:
Angle for 40%=40×3.6∘=144∘
The angle corresponding to the second class in the pie chart is 144∘.
The angle corresponding to second class is (c) 144∘.
Topper's Solved these Questions
Similar Questions
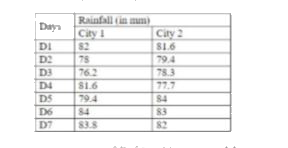
The Table given below presents the Rainfall (in mm) in two cities on different days of a week.

If the data of Rainfall of city 1 is represented through a Pie chart, then what will be the central angle (nearest to 0.1 degree) corresponding to D1?
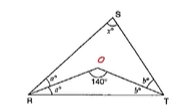
View SolutionIn rst, what is the value of x ? 40 (b) 900 (c) 800 (d) 100

View Solution
Knowledge Check
In a test in Mathematics 20% of the students obtained first class If the data are represented by a Pie Chart, what is the central angle corresponding to "first class''?
(a)20∘
(b)36∘
(c)72∘
(d)144∘A20∘B36∘C72∘D144∘In a test in Mathematics, 20% of the students obtained ''first class''. If the data are represented by a Pie - chart, what is the central angle corresponding to ''first class''?
A20∘B36∘C72∘D144∘IF the data about students of the commerce stream in all colleges is represented by a pie chart. What is the central angle of the sector representing college D, to the nearest degree
A66∘B82∘C88∘D85∘
In a History examination, the average for the entire class was 80 marks. If 10% of the students scored 95 marks and 20% scored 90 marks, what was the average marks of the remaining students of the class? 65.5 b. 72.5 c. 75 d. 85
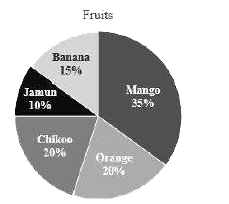
View SolutionThe following pie chart shows fruit tree distribution in a farm land. Consider the chart and answer questions based on it .

The sector angle corresponding to the Banana is
A. 90∘
B. 54∘
C. 72∘
D. 36∘
View SolutionIn a competitive examination in State A, 6% candidates got selected from the total appeared candidates. State B had an equal number of candidates appeared and 7% candidates got selected with 80 more candidates got selected than A. what was the number of candidates appeared from each state? 7600 b. 8400 c. 8000 d. Data inadequate
View SolutionIn an examination a candidate must get 65% marks to pass. If a candidate got 210 marks and fails by 50 marks. Out of how many marks was the examination?
(a)325
(b)335
(c)400
(d)355
View SolutionIn an examination A got 25% marks more than B. B got 10% less than C and C got 25% more than D. If D got 320 marks out of 500, the marks obtained by A were
View Solution
