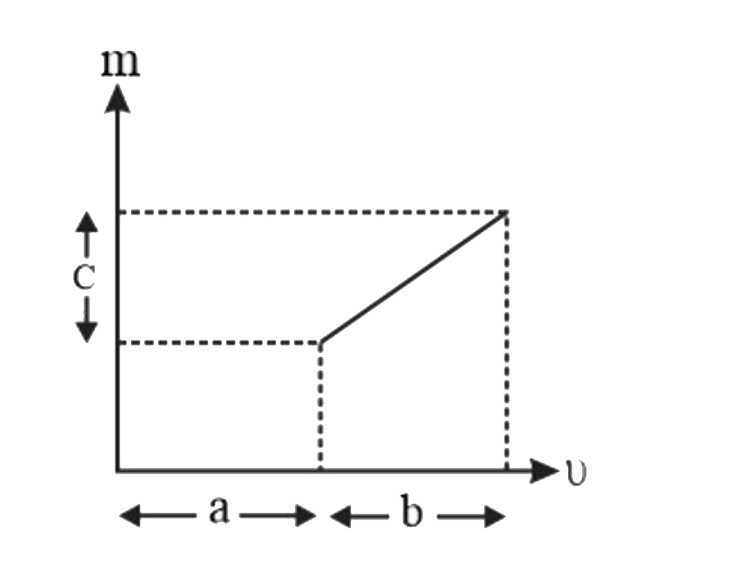
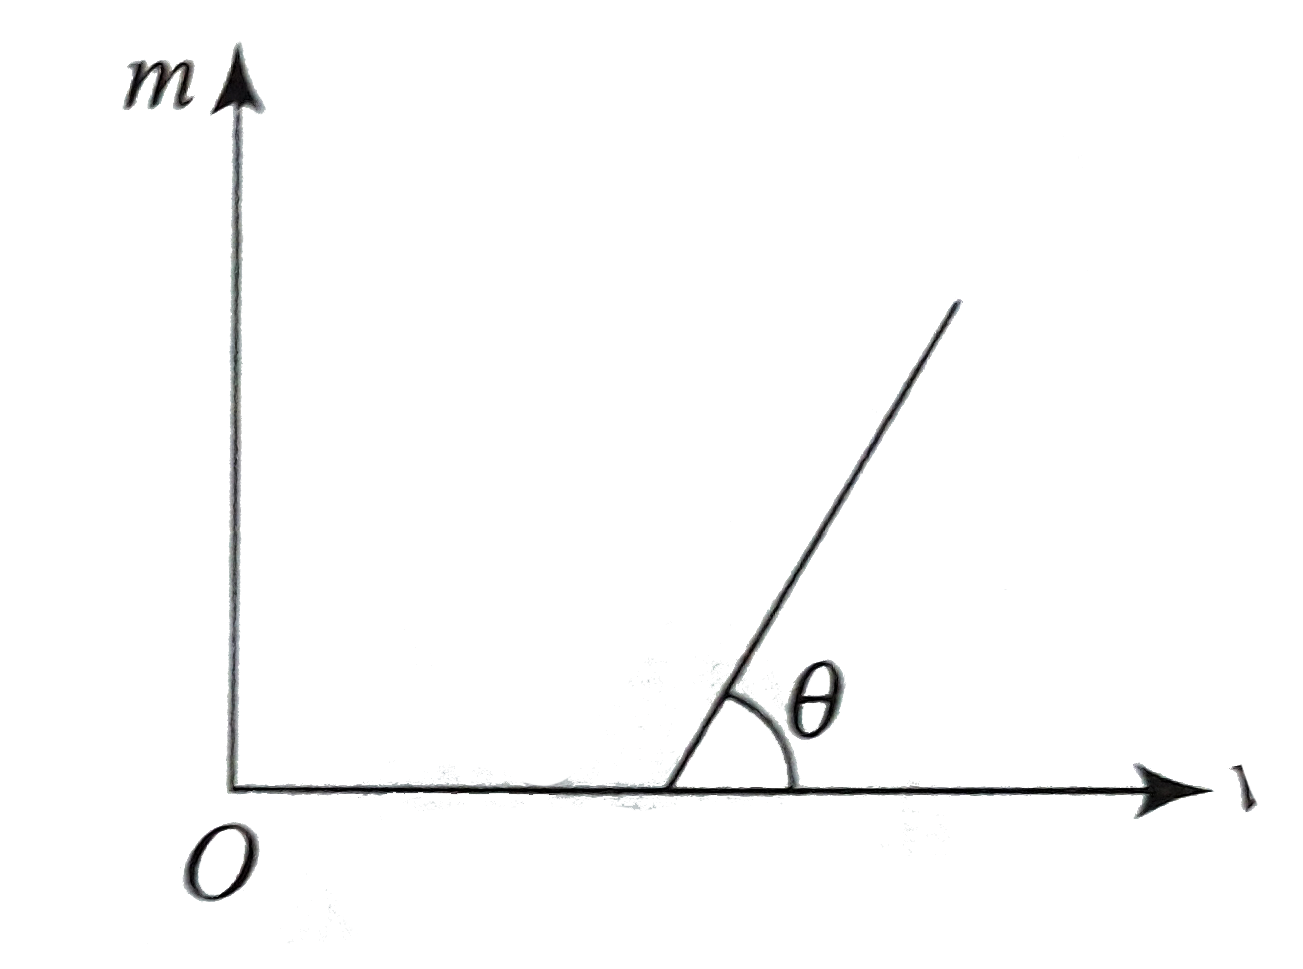
The graph shows how the magnification m produced by a thin lens varies with image distance v. The focal length of the lens used is
b/c
b/ca
bc/a
c/b
The correct Answer is:A
1v+1u=1f∴U=fvf−v
∴vu=f−vf=1−vf
|m|=∣∣∣1−vf∣∣∣∴ slope 1f=b/c
Similar Questions
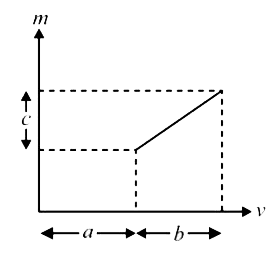
The graph shows how the magnification m produced by a thin lens varies with image distance v. What is the focal length of the lens used?
View SolutionThe graph shows how the magnification m produced by a thin lens varies with image distance v. What is the focal length of the lens used?

View SolutionThe graph shows how the magnification m produced by a convex thin lens varies with image distance v. What was the focal length of the used ?
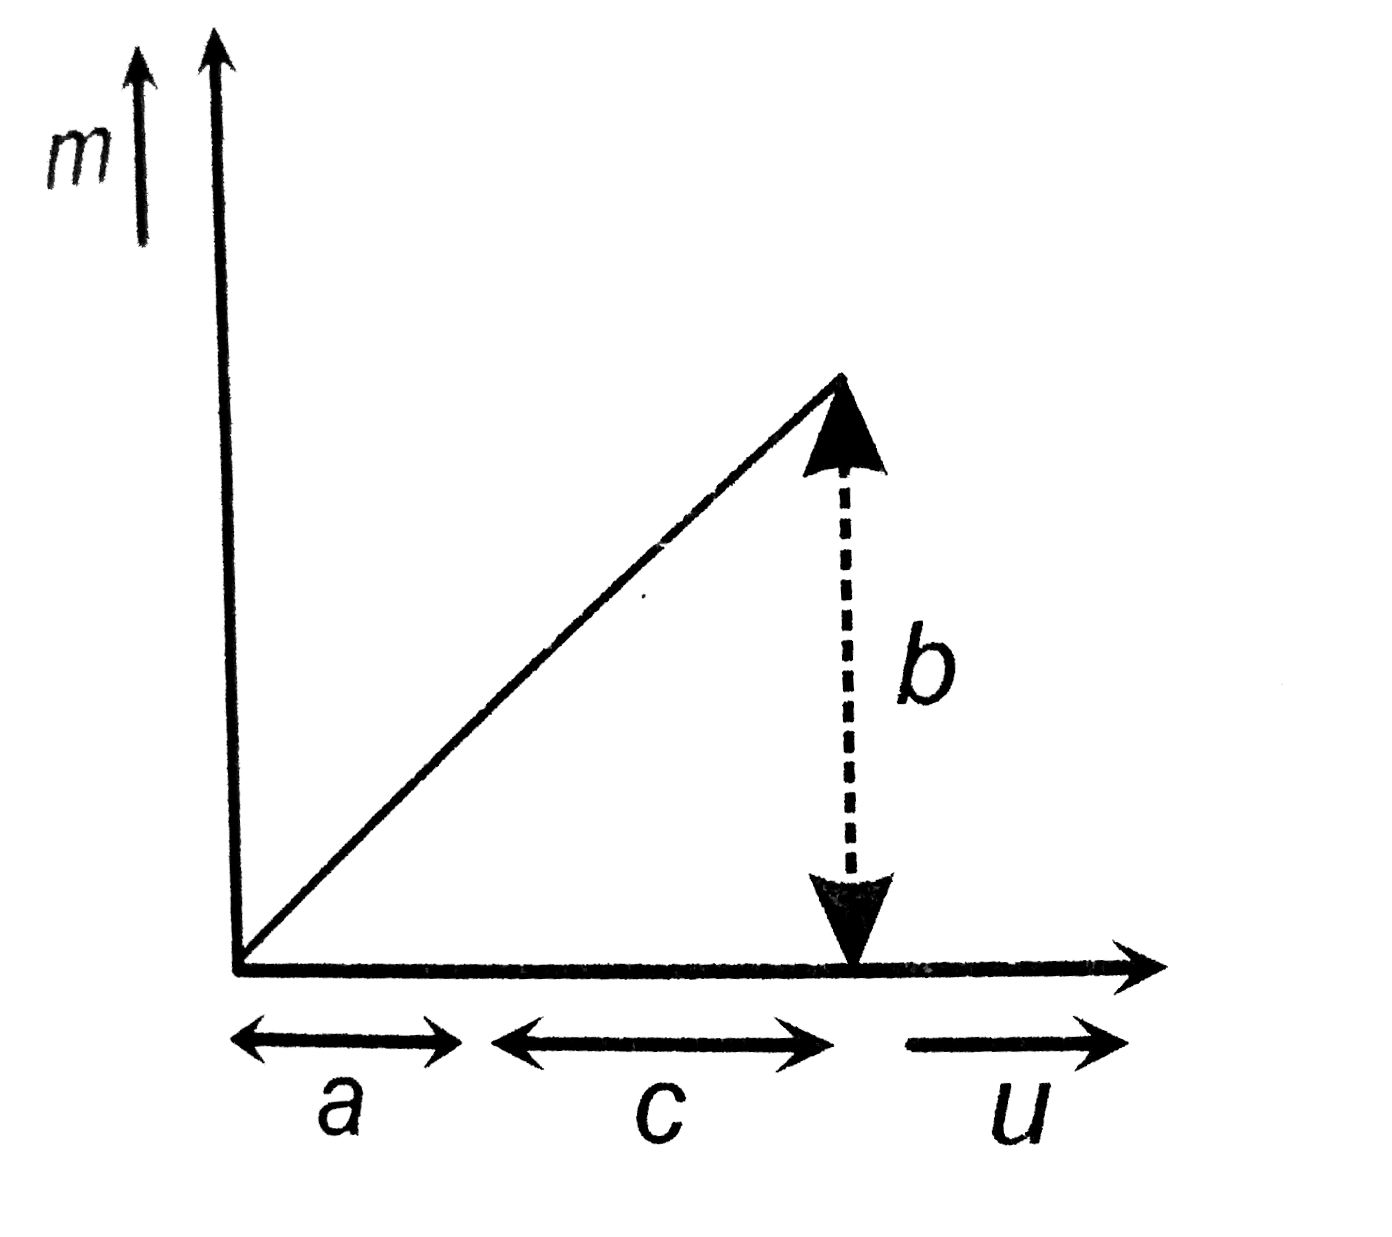
View SolutionFind the focal length of the lens used.
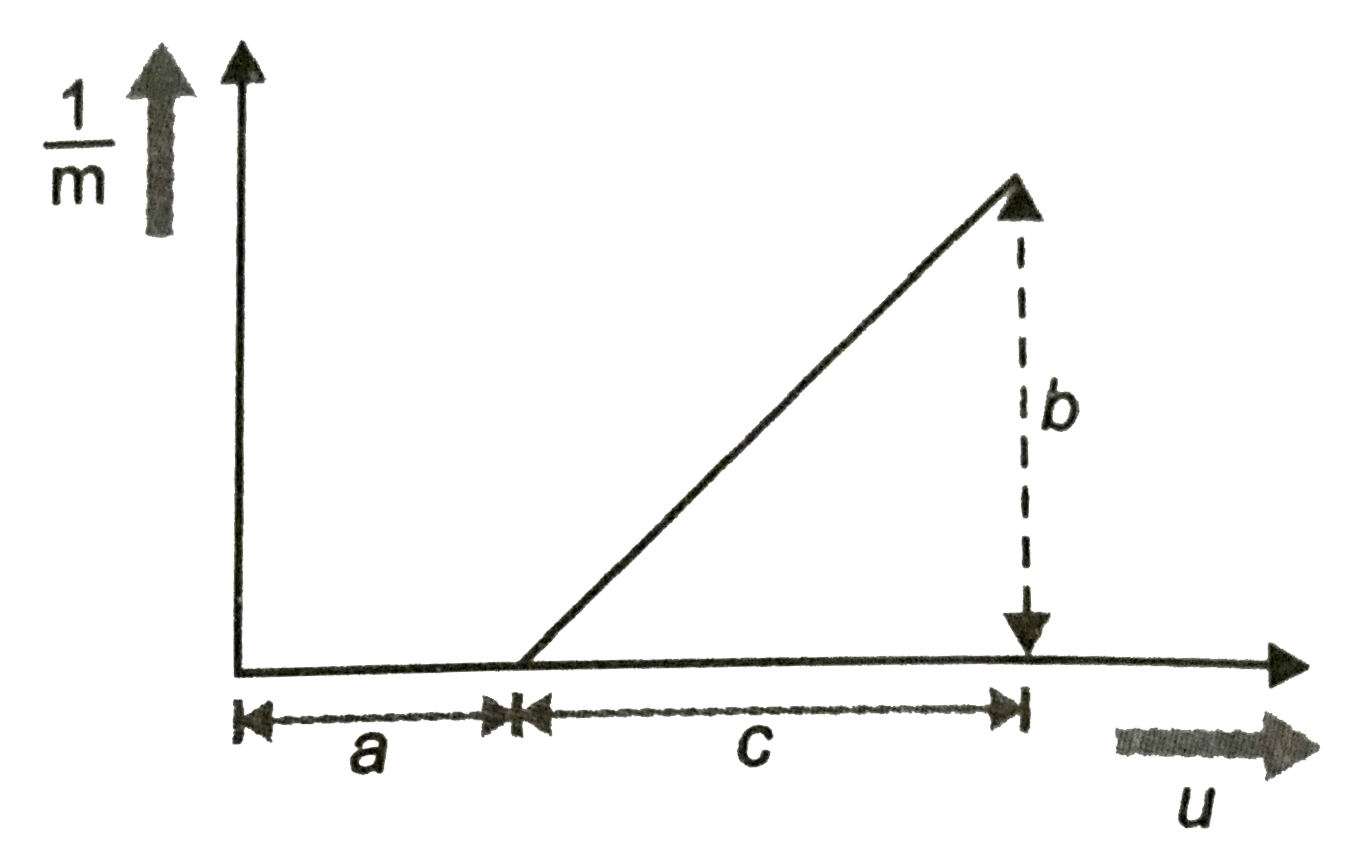
View SolutionThe graph in Fig. shows how the inverse of magnification 1/m produced by a convex thin lens varies with object distance u. What was the focal length of the lens used ?
 .
.
View SolutionFigure, shows variation of magnification m (produced by a thin convex lens) and distance v of image from pole of the lens. When of the following statements are correct?
View SolutionA convex lens of focal length f is placed somewhere in between an object and a screen. The distance between the object and the screen is x. If the numerical value of the magnification produced by the lens is m, then the focal lnegth oof the lens is .
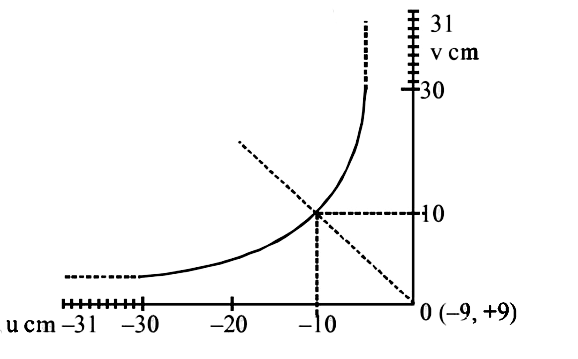
View SolutionThe graph shown relationship between object distance and image distance for a equiconvex lens. Then focal length of the lens is
View SolutionThe magnification produced by a spherical lens is +2.5 . What is the nature of image ?
View SolutionA convex lens produces an image of a real object on a screen with a magnification of 1/2. When the lens is moved 30 cm away from the object, the magnification of the image on the screen is 2. The focal length of the lens is
View Solution