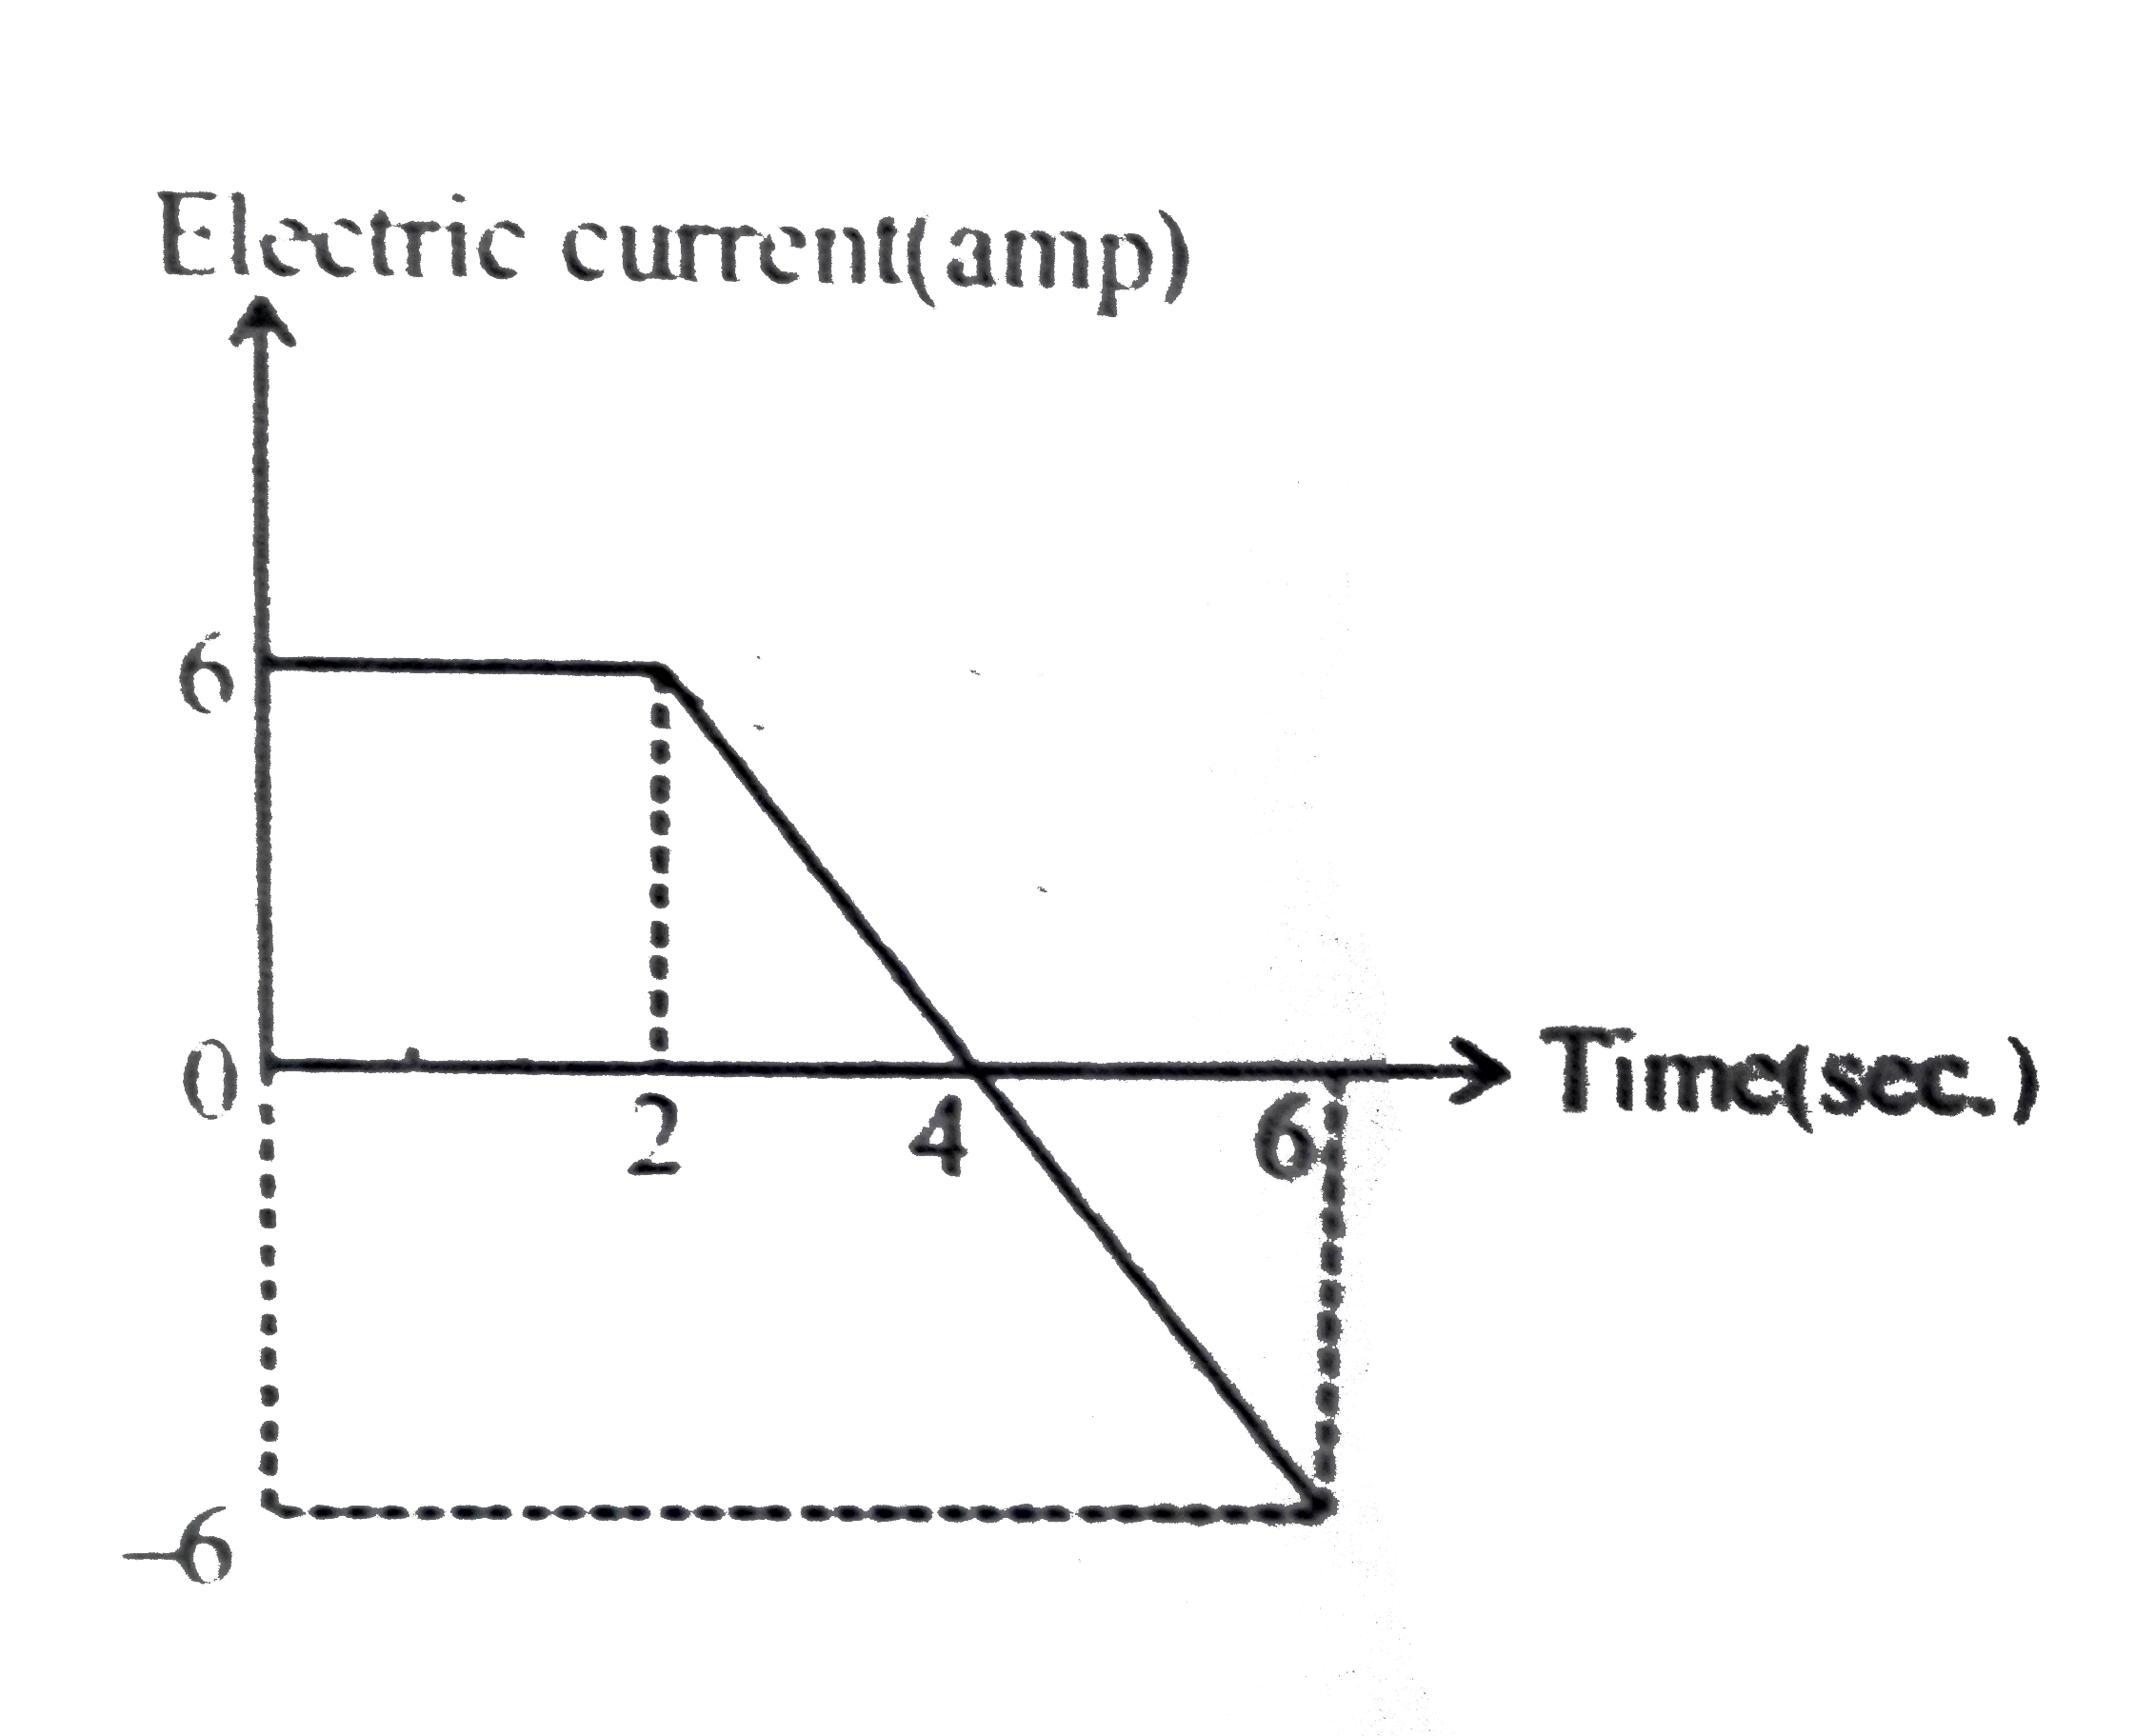
If Electric-current 'i' time (t) graph shown in figure. The average current in first 6 sec. is :-
1 amp
2 amp
6 amp
3 amp
The correct Answer is:B
iavg=area under (i-t) vurve(0−6)time interval(0−6)
=6×2(12×2×6)−12×2×66−0
=2amp.
Topper's Solved these Questions
Similar Questions
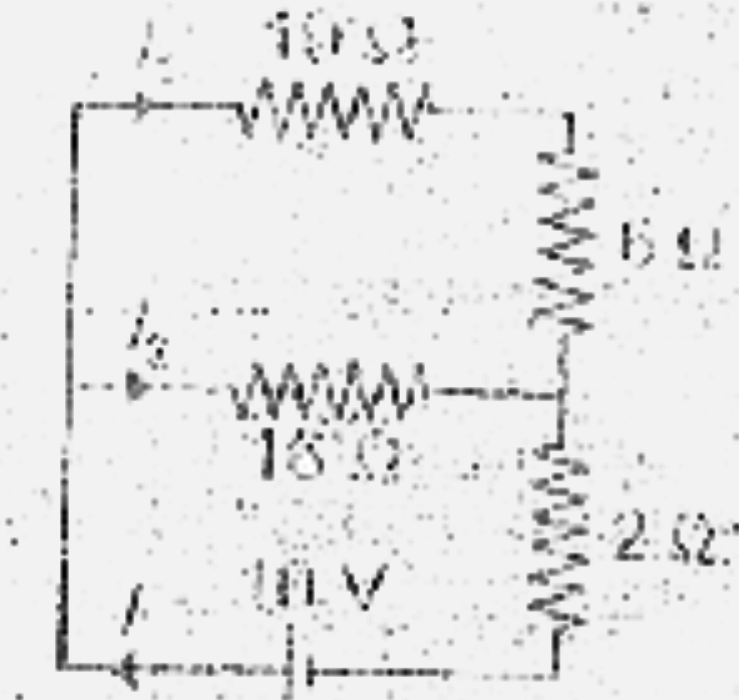
Current I in the network shown in figure
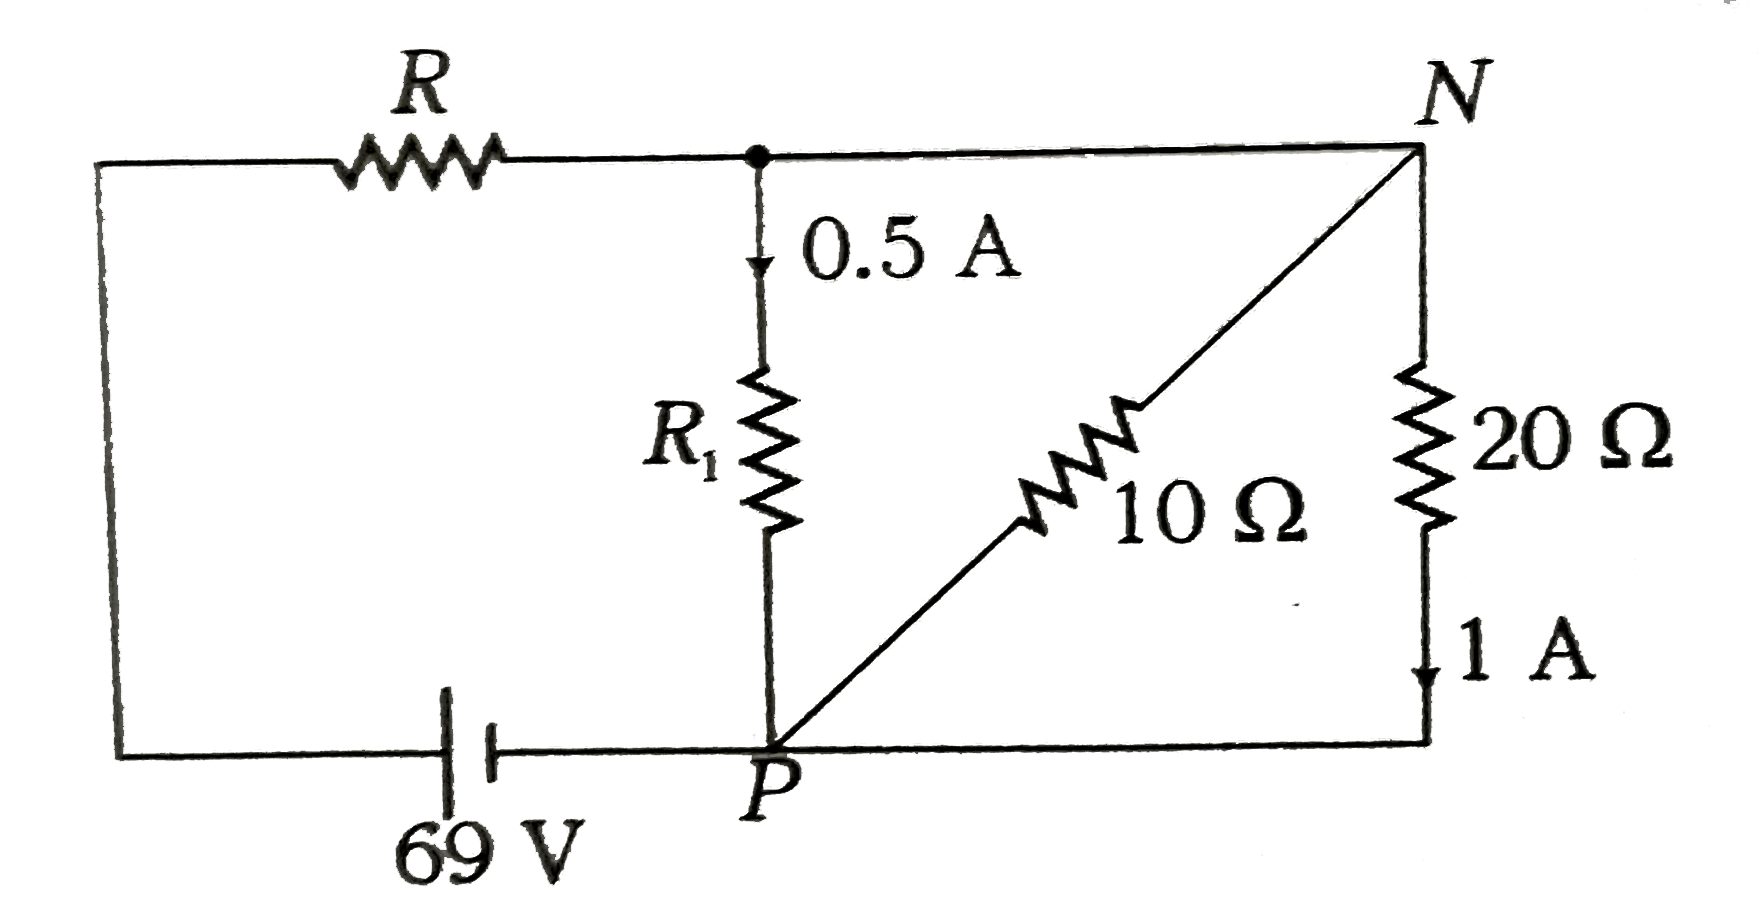
View SolutionIn the circuit shown in the figure,
View SolutionIn the circuit shown in the figure
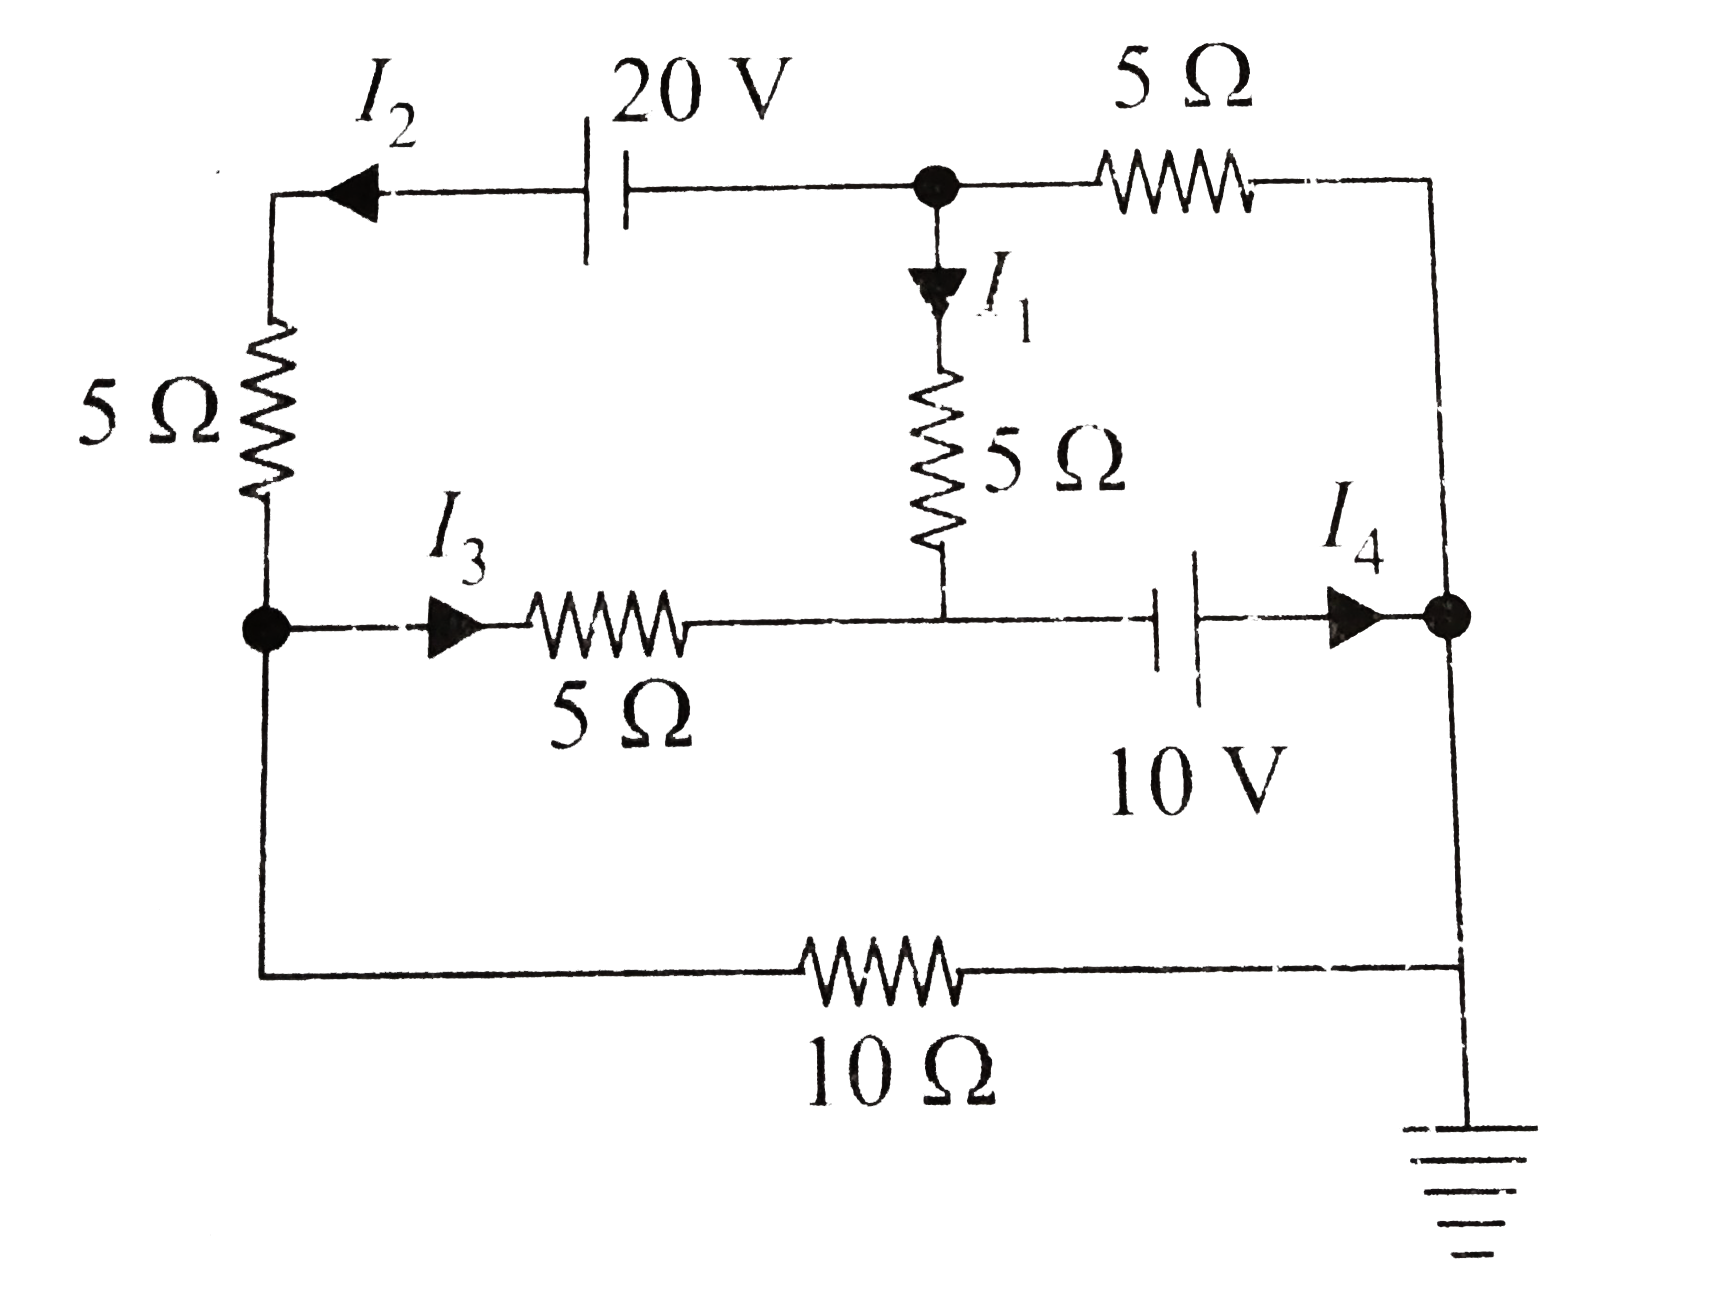 .
.
The value of current I4 is
View SolutionThe current I through a conductor varies with time t as shown in figure. The average electric current during t=0 to t=10 s will be
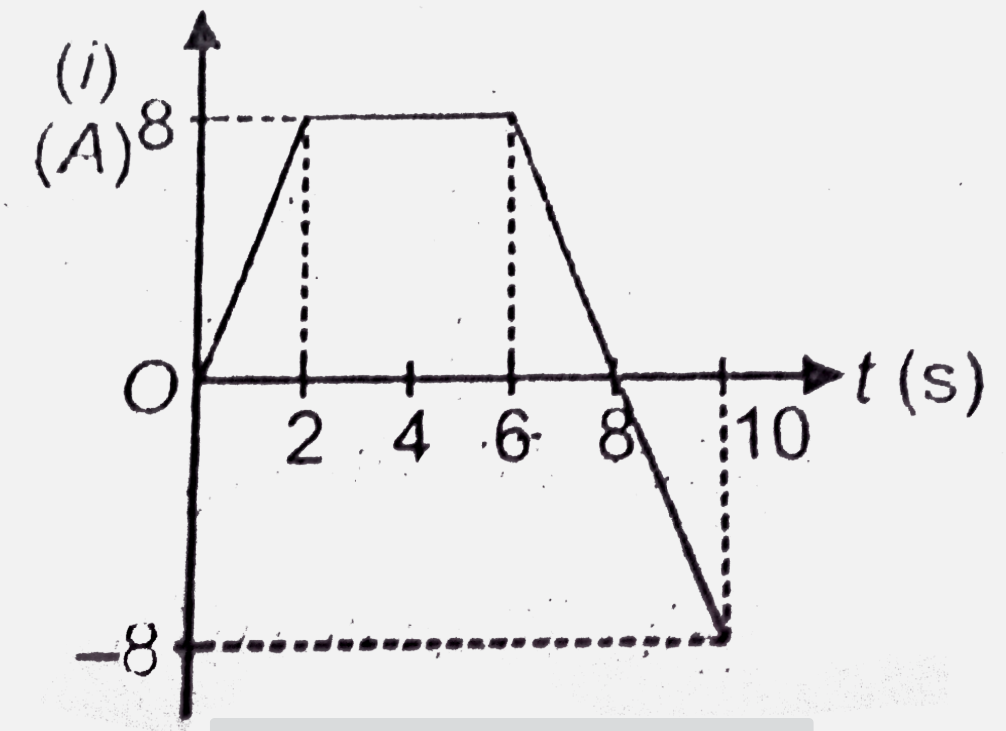
View SolutionFor the network shown in the figure the value of the current i is
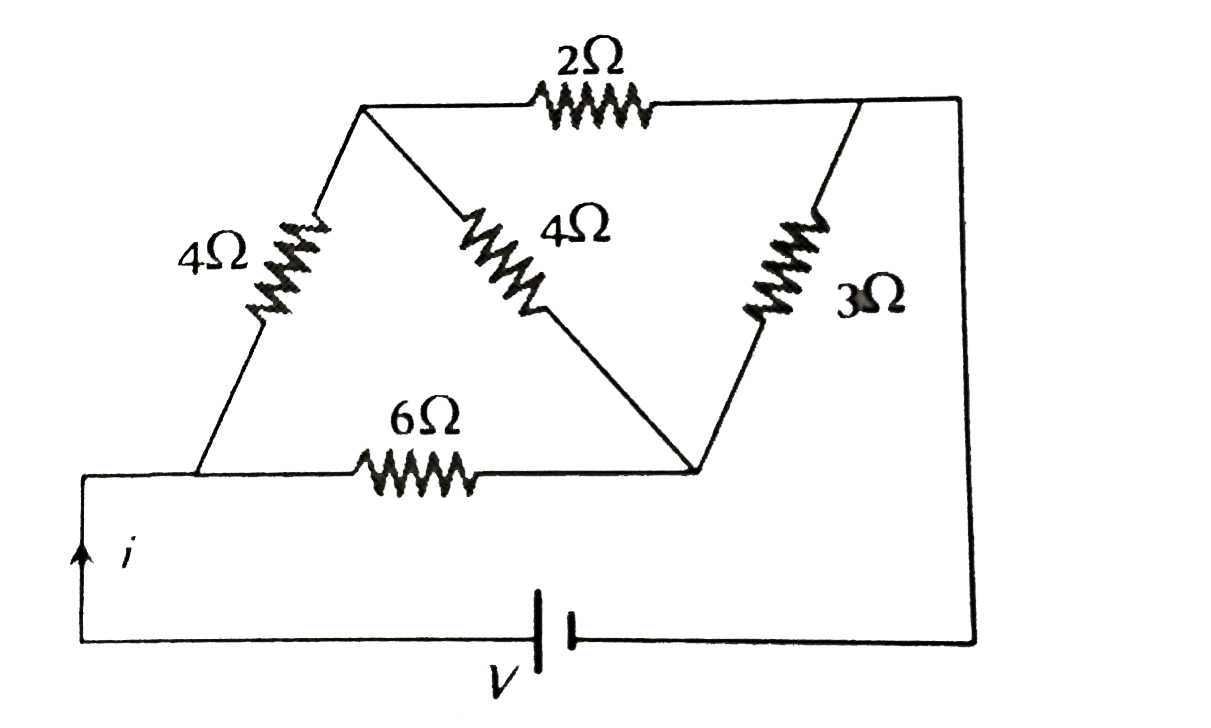
View SolutionFor the network shown in the figure the value of the current i is -

View SolutionThe current in a certain circuit varies with time as shown in figure. Find the average current and the rms current in terms of I0
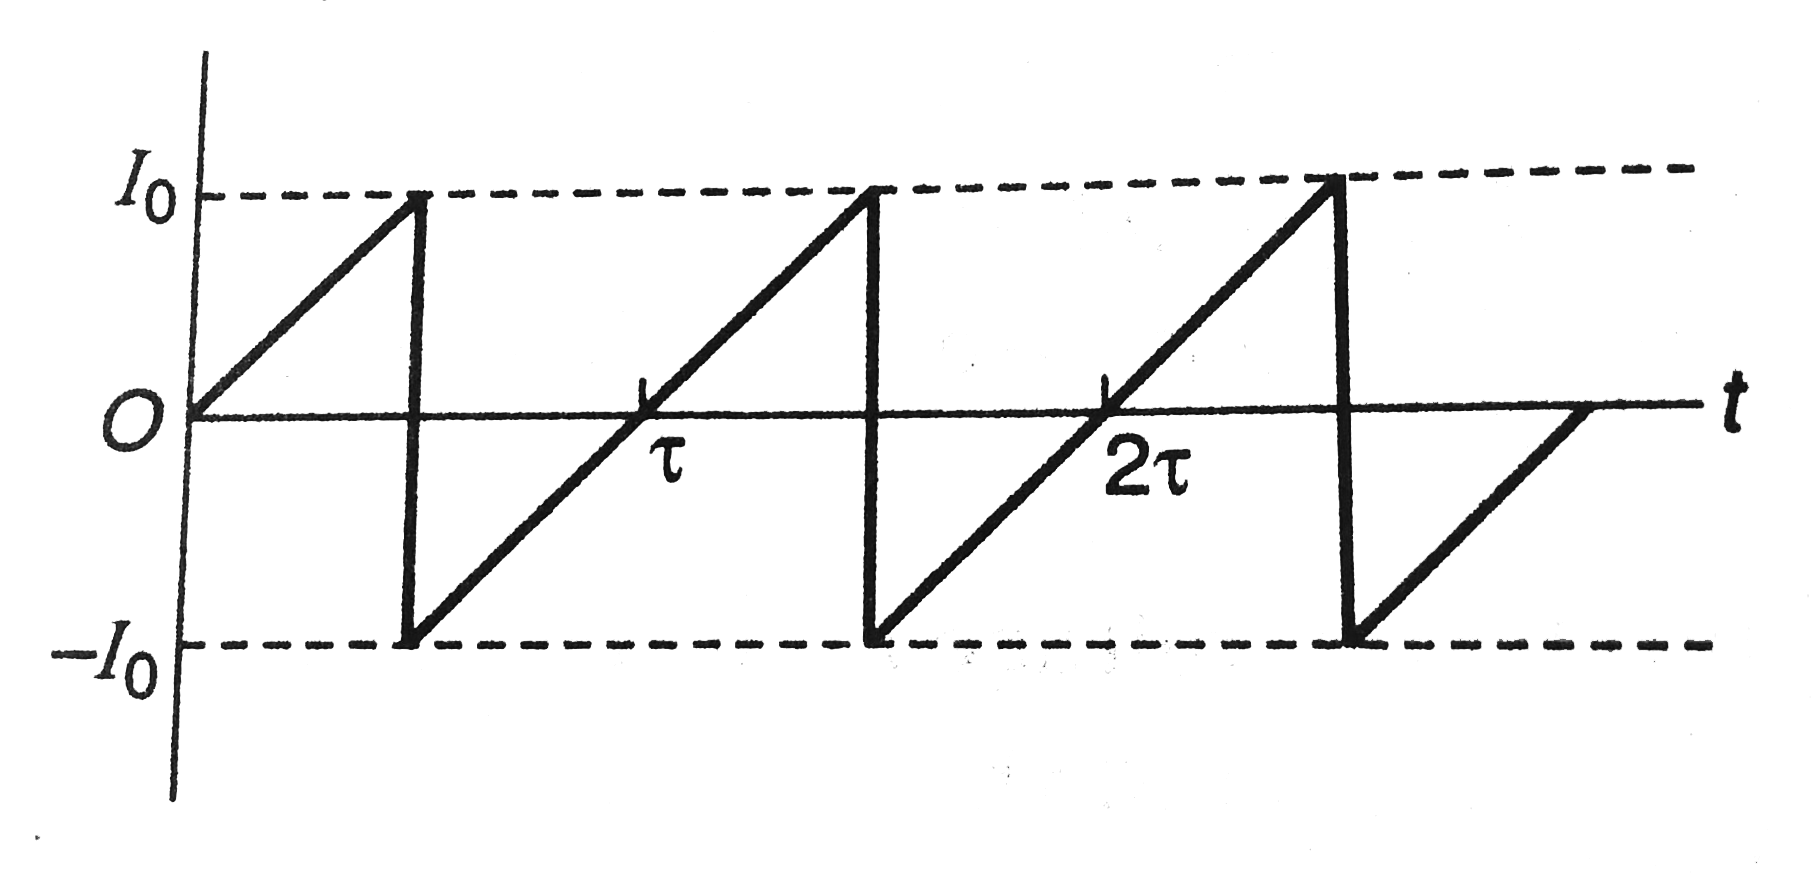 .
.
View SolutionFor the v-t graph shown in figure find the acccelertion in 0-4 sec and 4-8 sec.
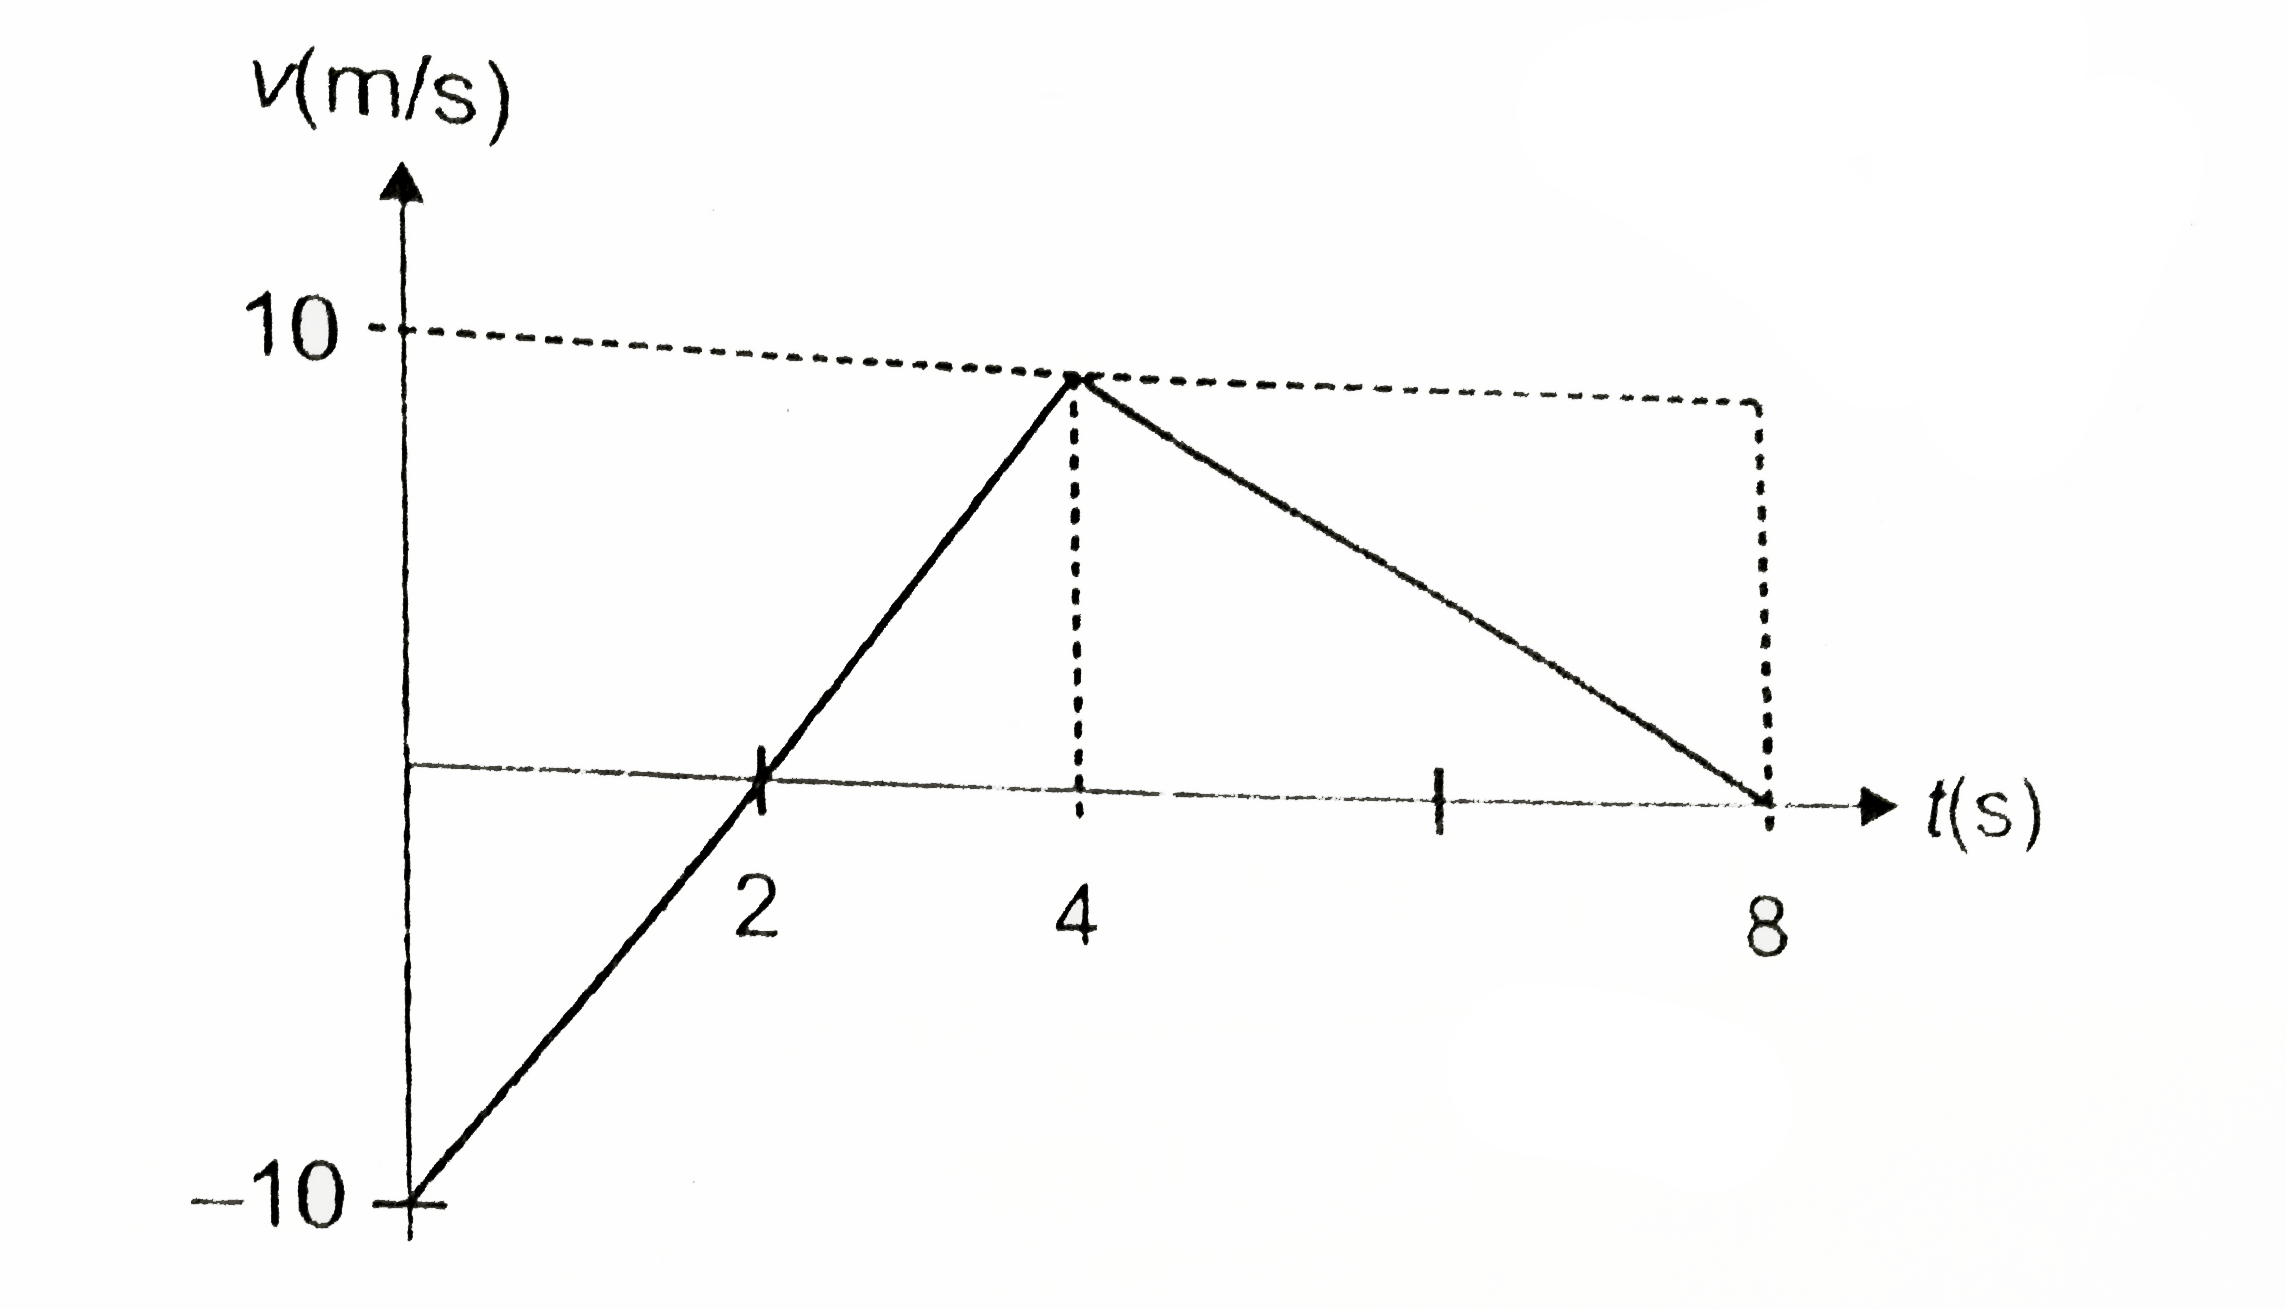
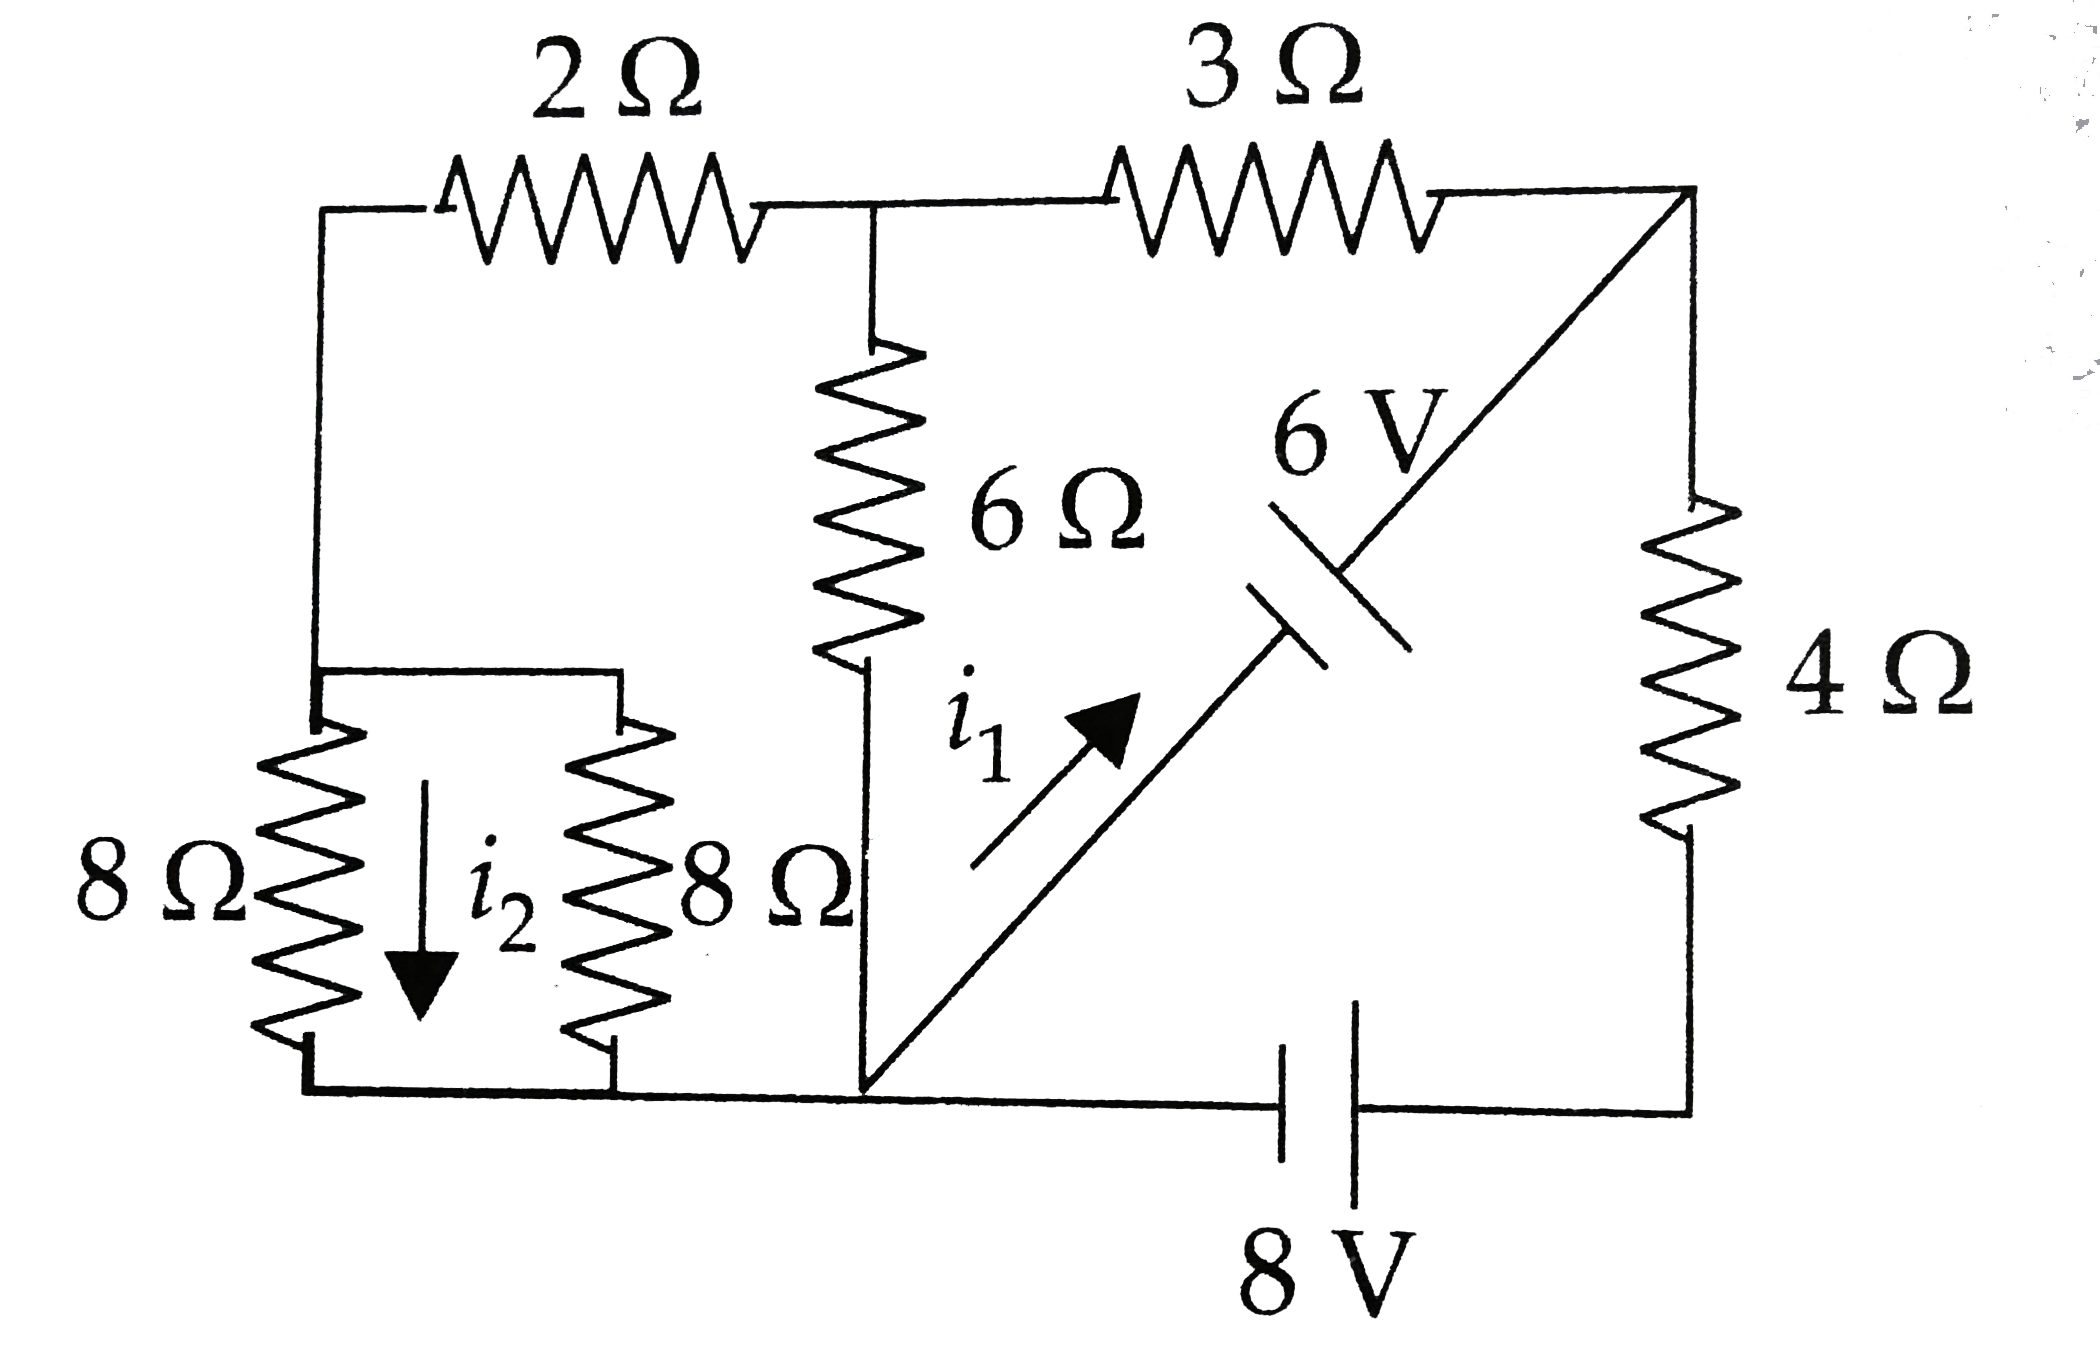
View SolutionIn the circuit as shown in figure, the ratio of current i1/i2 is
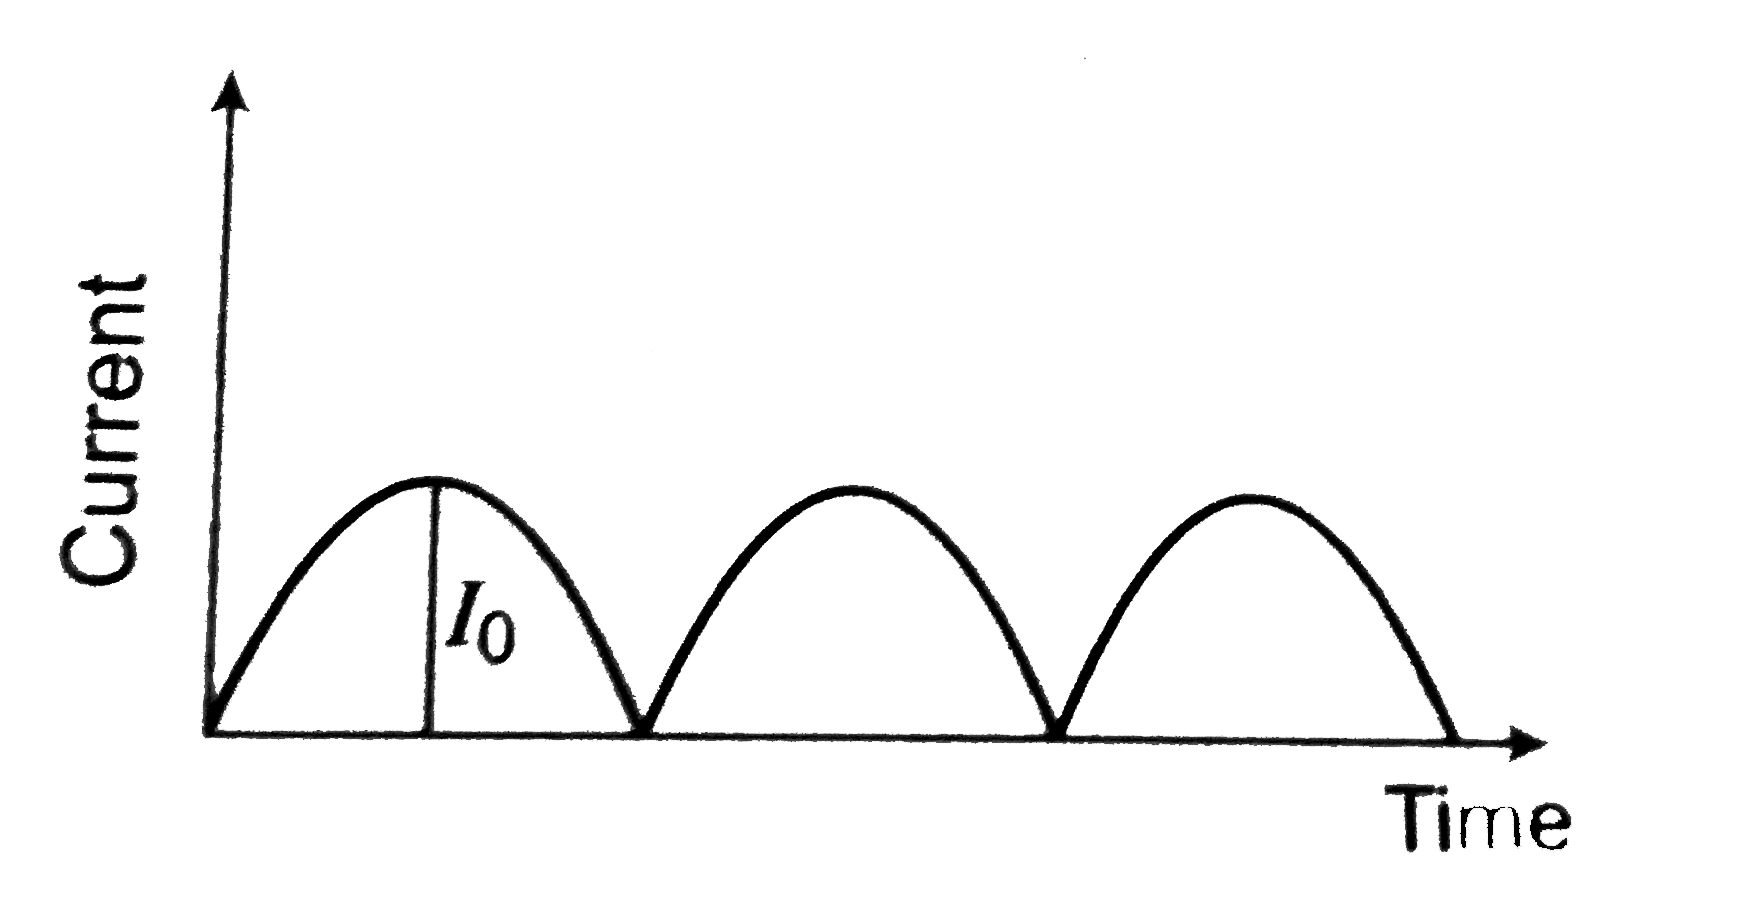
View SolutionThe output current versus time curve of a rectifier is shown in the figure. The average value of output current in this case is
View Solution
