Consider a hypothetical situation where we are comparing the properties of two crystals made of atom A and atom B. Potential energy (U)v/s interatomic separation (r) graph for atom A and atom B is shown in figure (i) and (ii) and respectively.
_E01_202_Q01.png)
Choose correct statement
Their equilibrium position remains unchanged but average separation decreases
Their equilibrium position remains unchanged but average separation increases
Their separation at equilibrium position as well as average separation increases
Their separation at equilibrium position decreases but average separation increases
The correct Answer is:B
The equilibrium remain unchanged but average distance increases.
Topper's Solved these Questions
- GEOMETRICAL OPTICSBOOK - ALLENCHAPTER - GEOMETRICAL OPTICSEXERCISE - EXERCISE - 04 (A)
47 Videos
- GEOMETRICAL OPTICSBOOK - ALLENCHAPTER - GEOMETRICAL OPTICSEXERCISE - EXERCISE - 04 (B)
15 Videos
- GEOMETRICAL OPTICSBOOK - ALLENCHAPTER - GEOMETRICAL OPTICSEXERCISE - ASSERTION-REASON
36 Videos
- CURRENT ELECTRICITYBOOK - ALLENCHAPTER - CURRENT ELECTRICITYEXERCISE - EX.II
66 Videos
- GRAVITATIONBOOK - ALLENCHAPTER - GRAVITATIONEXERCISE - EXERCISE 4
9 Videos
Similar Questions
Consider a hypothetical situation where we are comparing the properties of two crystals made of atom A and atom B. Potential energy (U)v/s interatomic separation (r) graph for atom A and atom B is shown in figure (i) and (ii) and respectively.
_E01_204_Q01.png)
It is seen that the potential energy can reach a maximum value of UT at temperature T=10K. if r1 and r2 are 0.9999r0and1.0003r0 for atoms of crystal A, its approximate coefficient of linear expansion can be :-
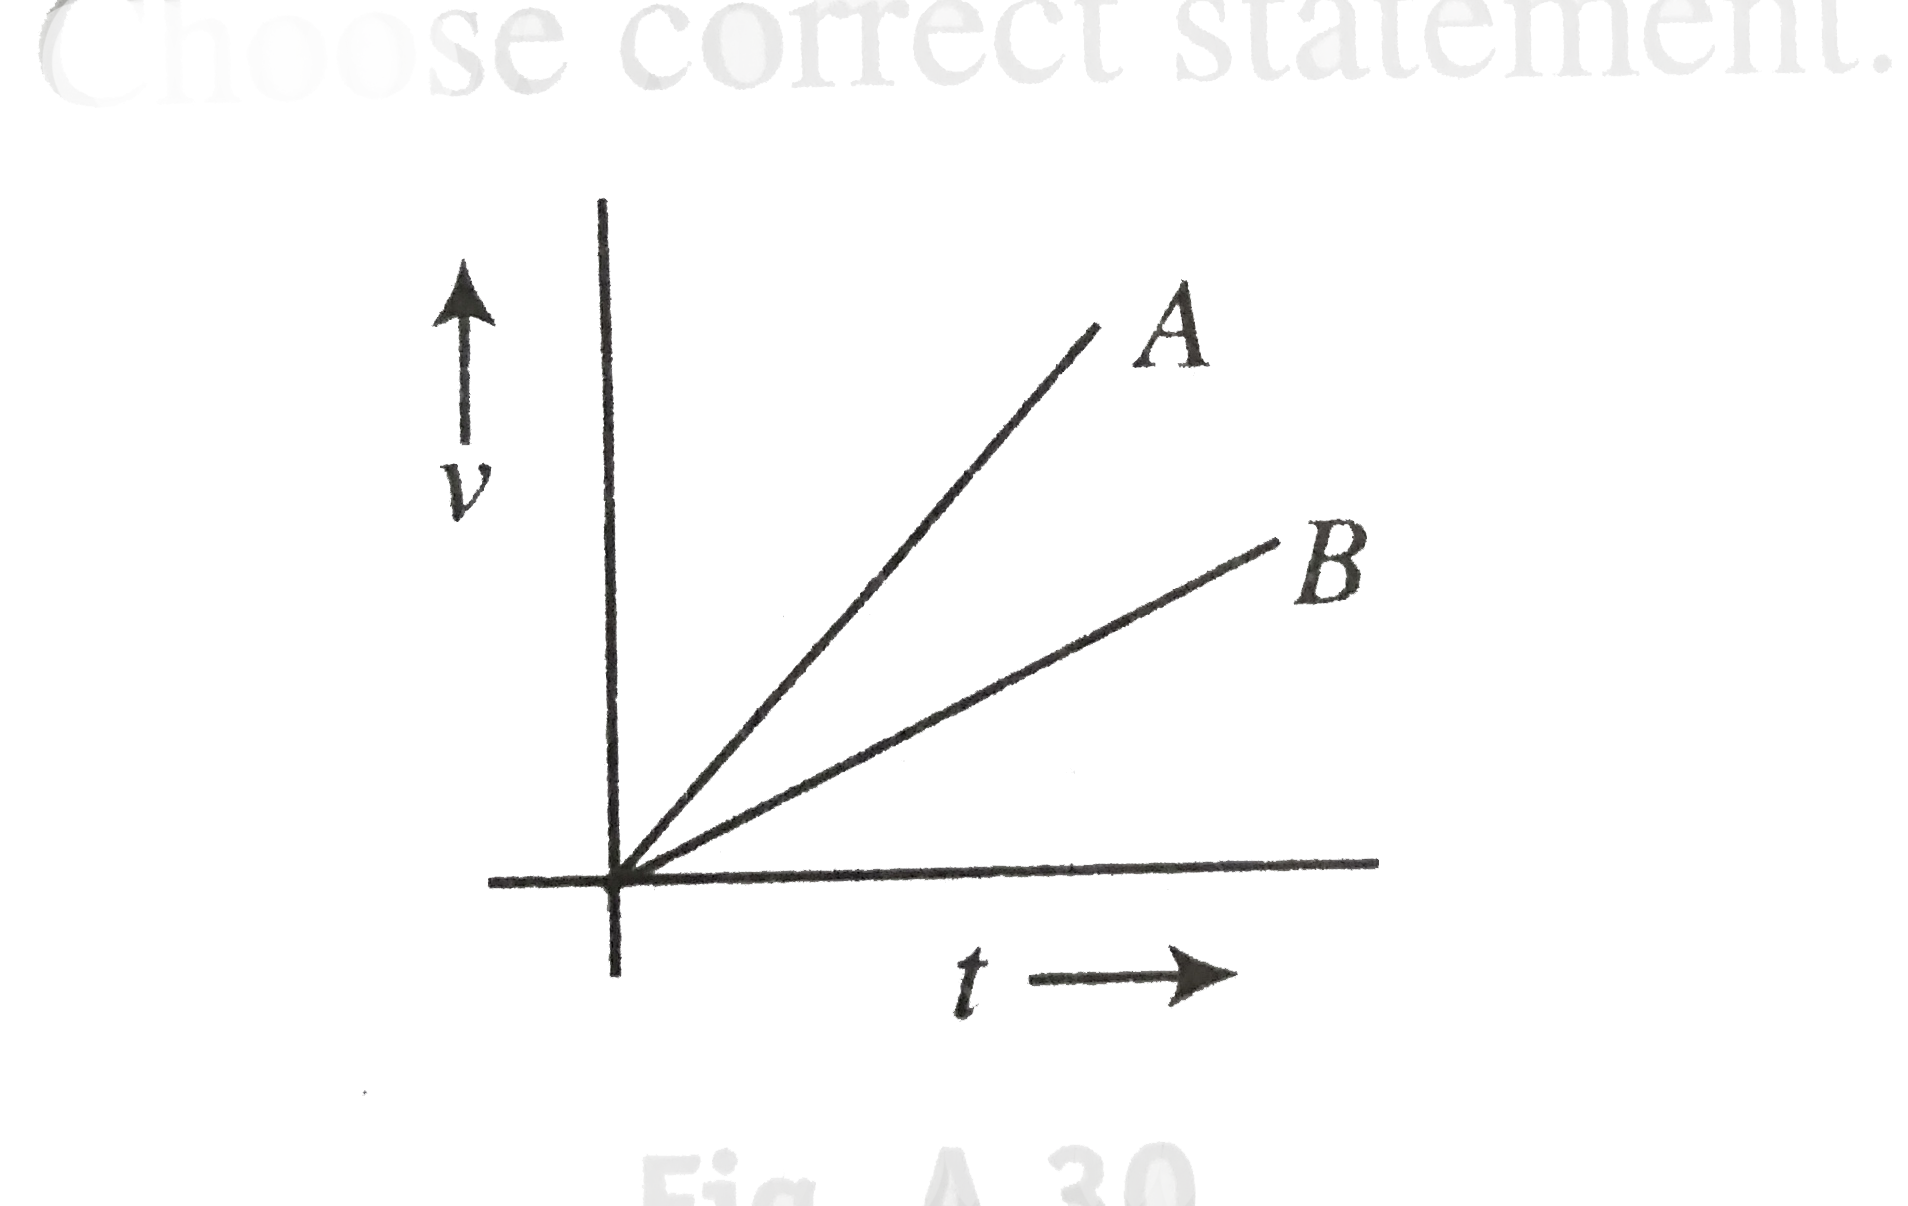
View SolutionThe velocity - time graph of two bodies A and B is shown in figure. Choose correct statement.
View SolutionThe energy levels of a hypothetical one electron atom are shown in figure

Find the ionization potential of the atom.
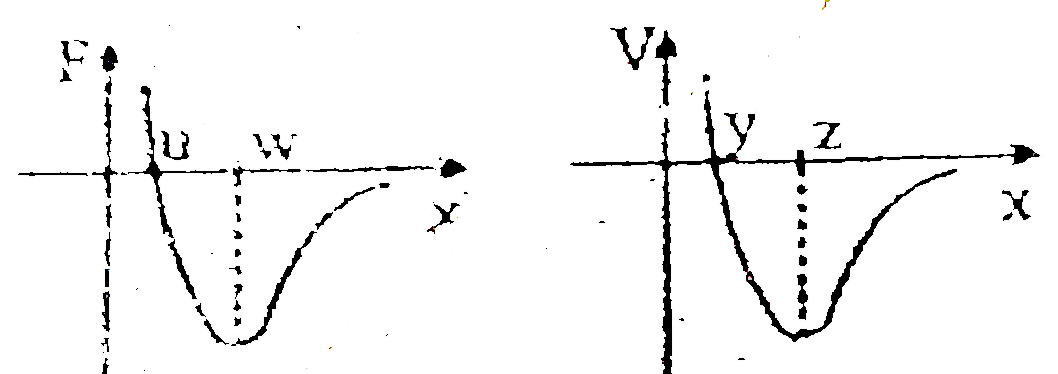
View SolutionTwo atoms interact with each other according to the following force F and potential energy V diagrams. What is their equilibrium separation?
View SolutionWhich one of the figures I and II represents the correct measure of atomic radius (r)?
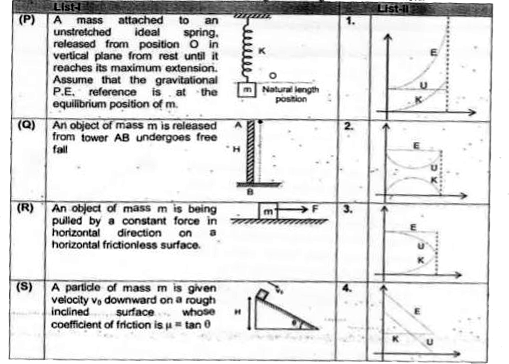
View SolutionThe physical situation in List-I with graphs of the variation of total energy (E), potential energy (U) and kinetic energy ( K) with time in List-II are given. Match the statements from List I with those in List II and select the correct answer using the code given below the lists.
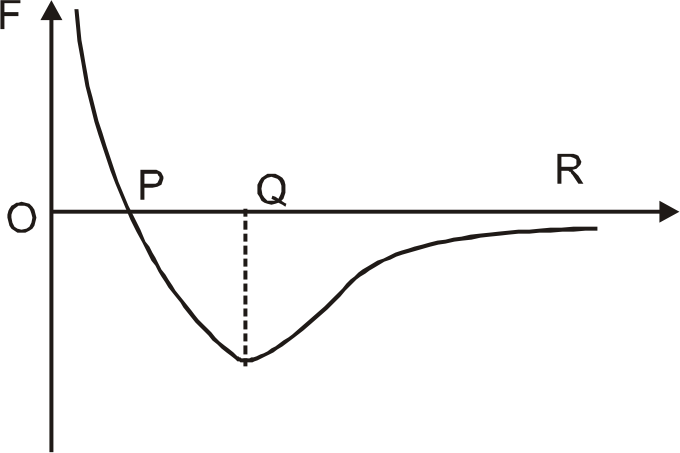
View SolutionFigure shows roughly how the force F between two adjacent atoms in a solid varies with inter atomic separation r. Which of the following statements are correct ?
View SolutionB has a smaller first ionization enthalpy than Be. Consider the following statements
(i) it is easier to remove 2p electron than 2s electron
(ii) 2p electron of B is more shielded from the nucleus by the inner core of electrons than the 2s electrons of Be
(iii) 2s electron has more penetration power than 2p electron
(iv) atomic radius of B is more than Be (atomic number B= 5, Be = 4) The correct statements are
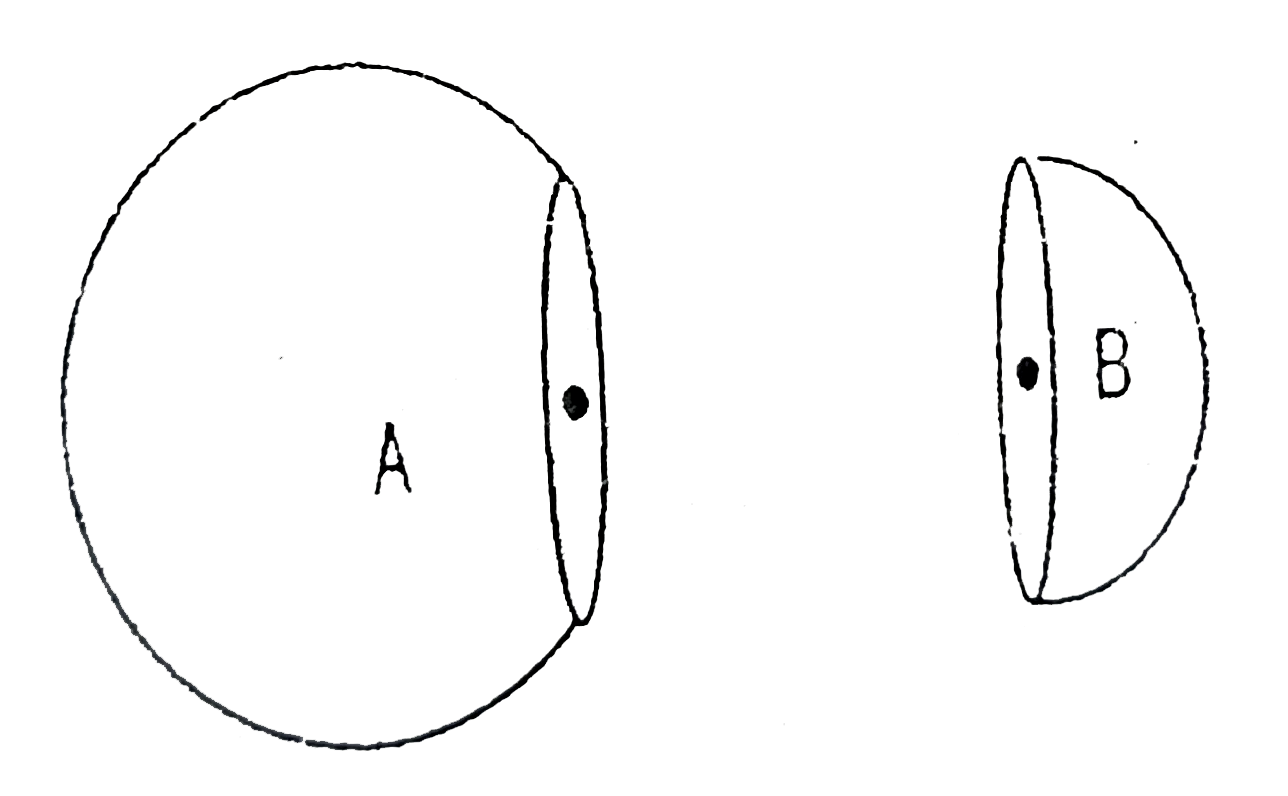
View SolutionA spherical shell is cut into two pieces along a chord and separated by large distance as shown in figure. For points A and B, where V and E are gravitational potential and field respectively
View SolutionIn the graph shown, the PE of earth-satellite system is shown by a solid line as a function of distance r (the separation between earth's centre and satellite). The total energy of the two objects which may or may not be bounded to the earth are shown in the figure by dotted lines.
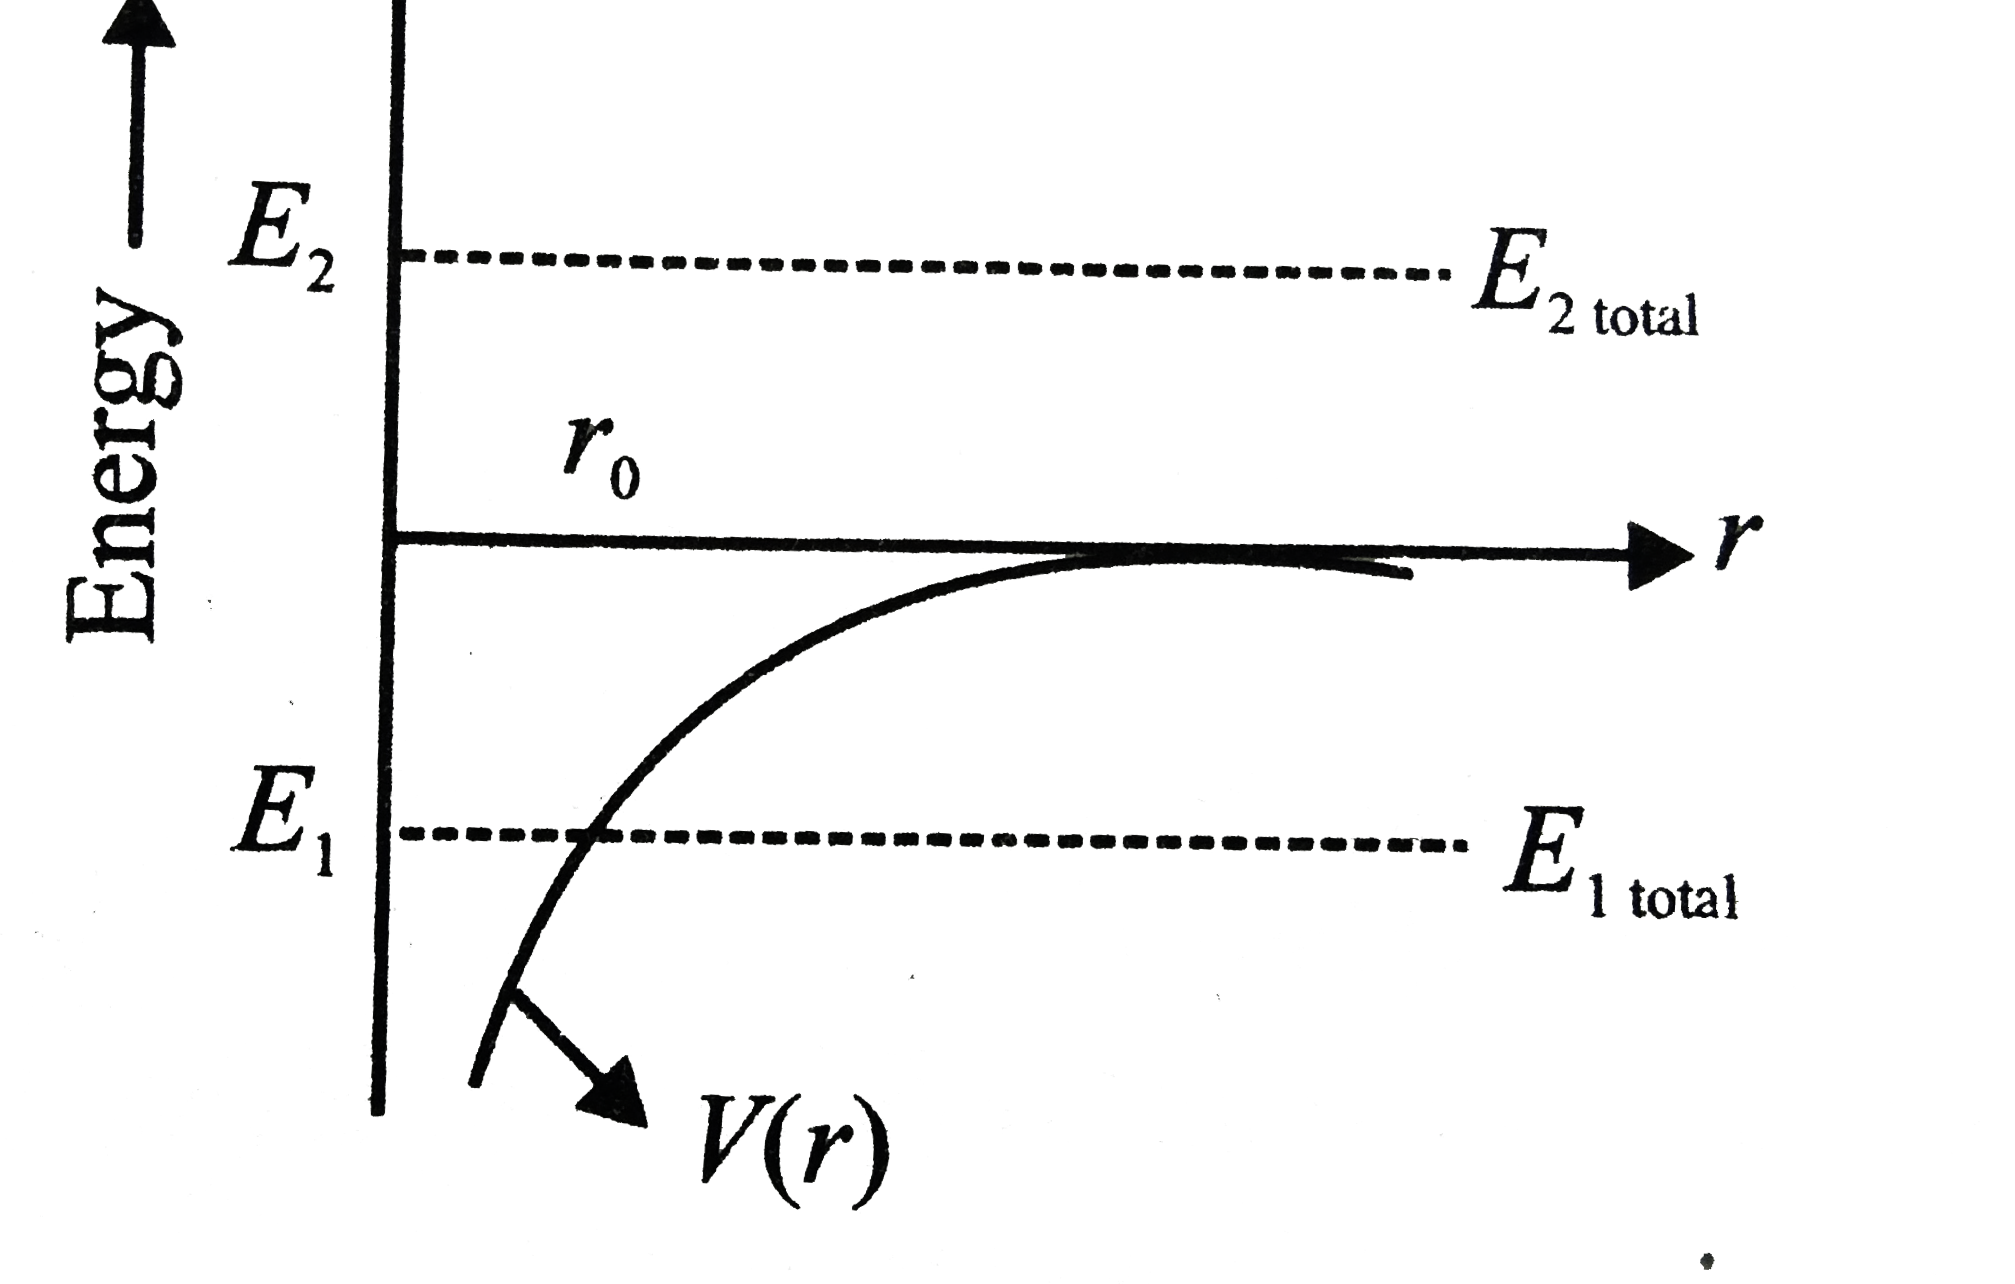
Based on the above information, answer the following questions.
Mark the correct statement(s).
View Solution
