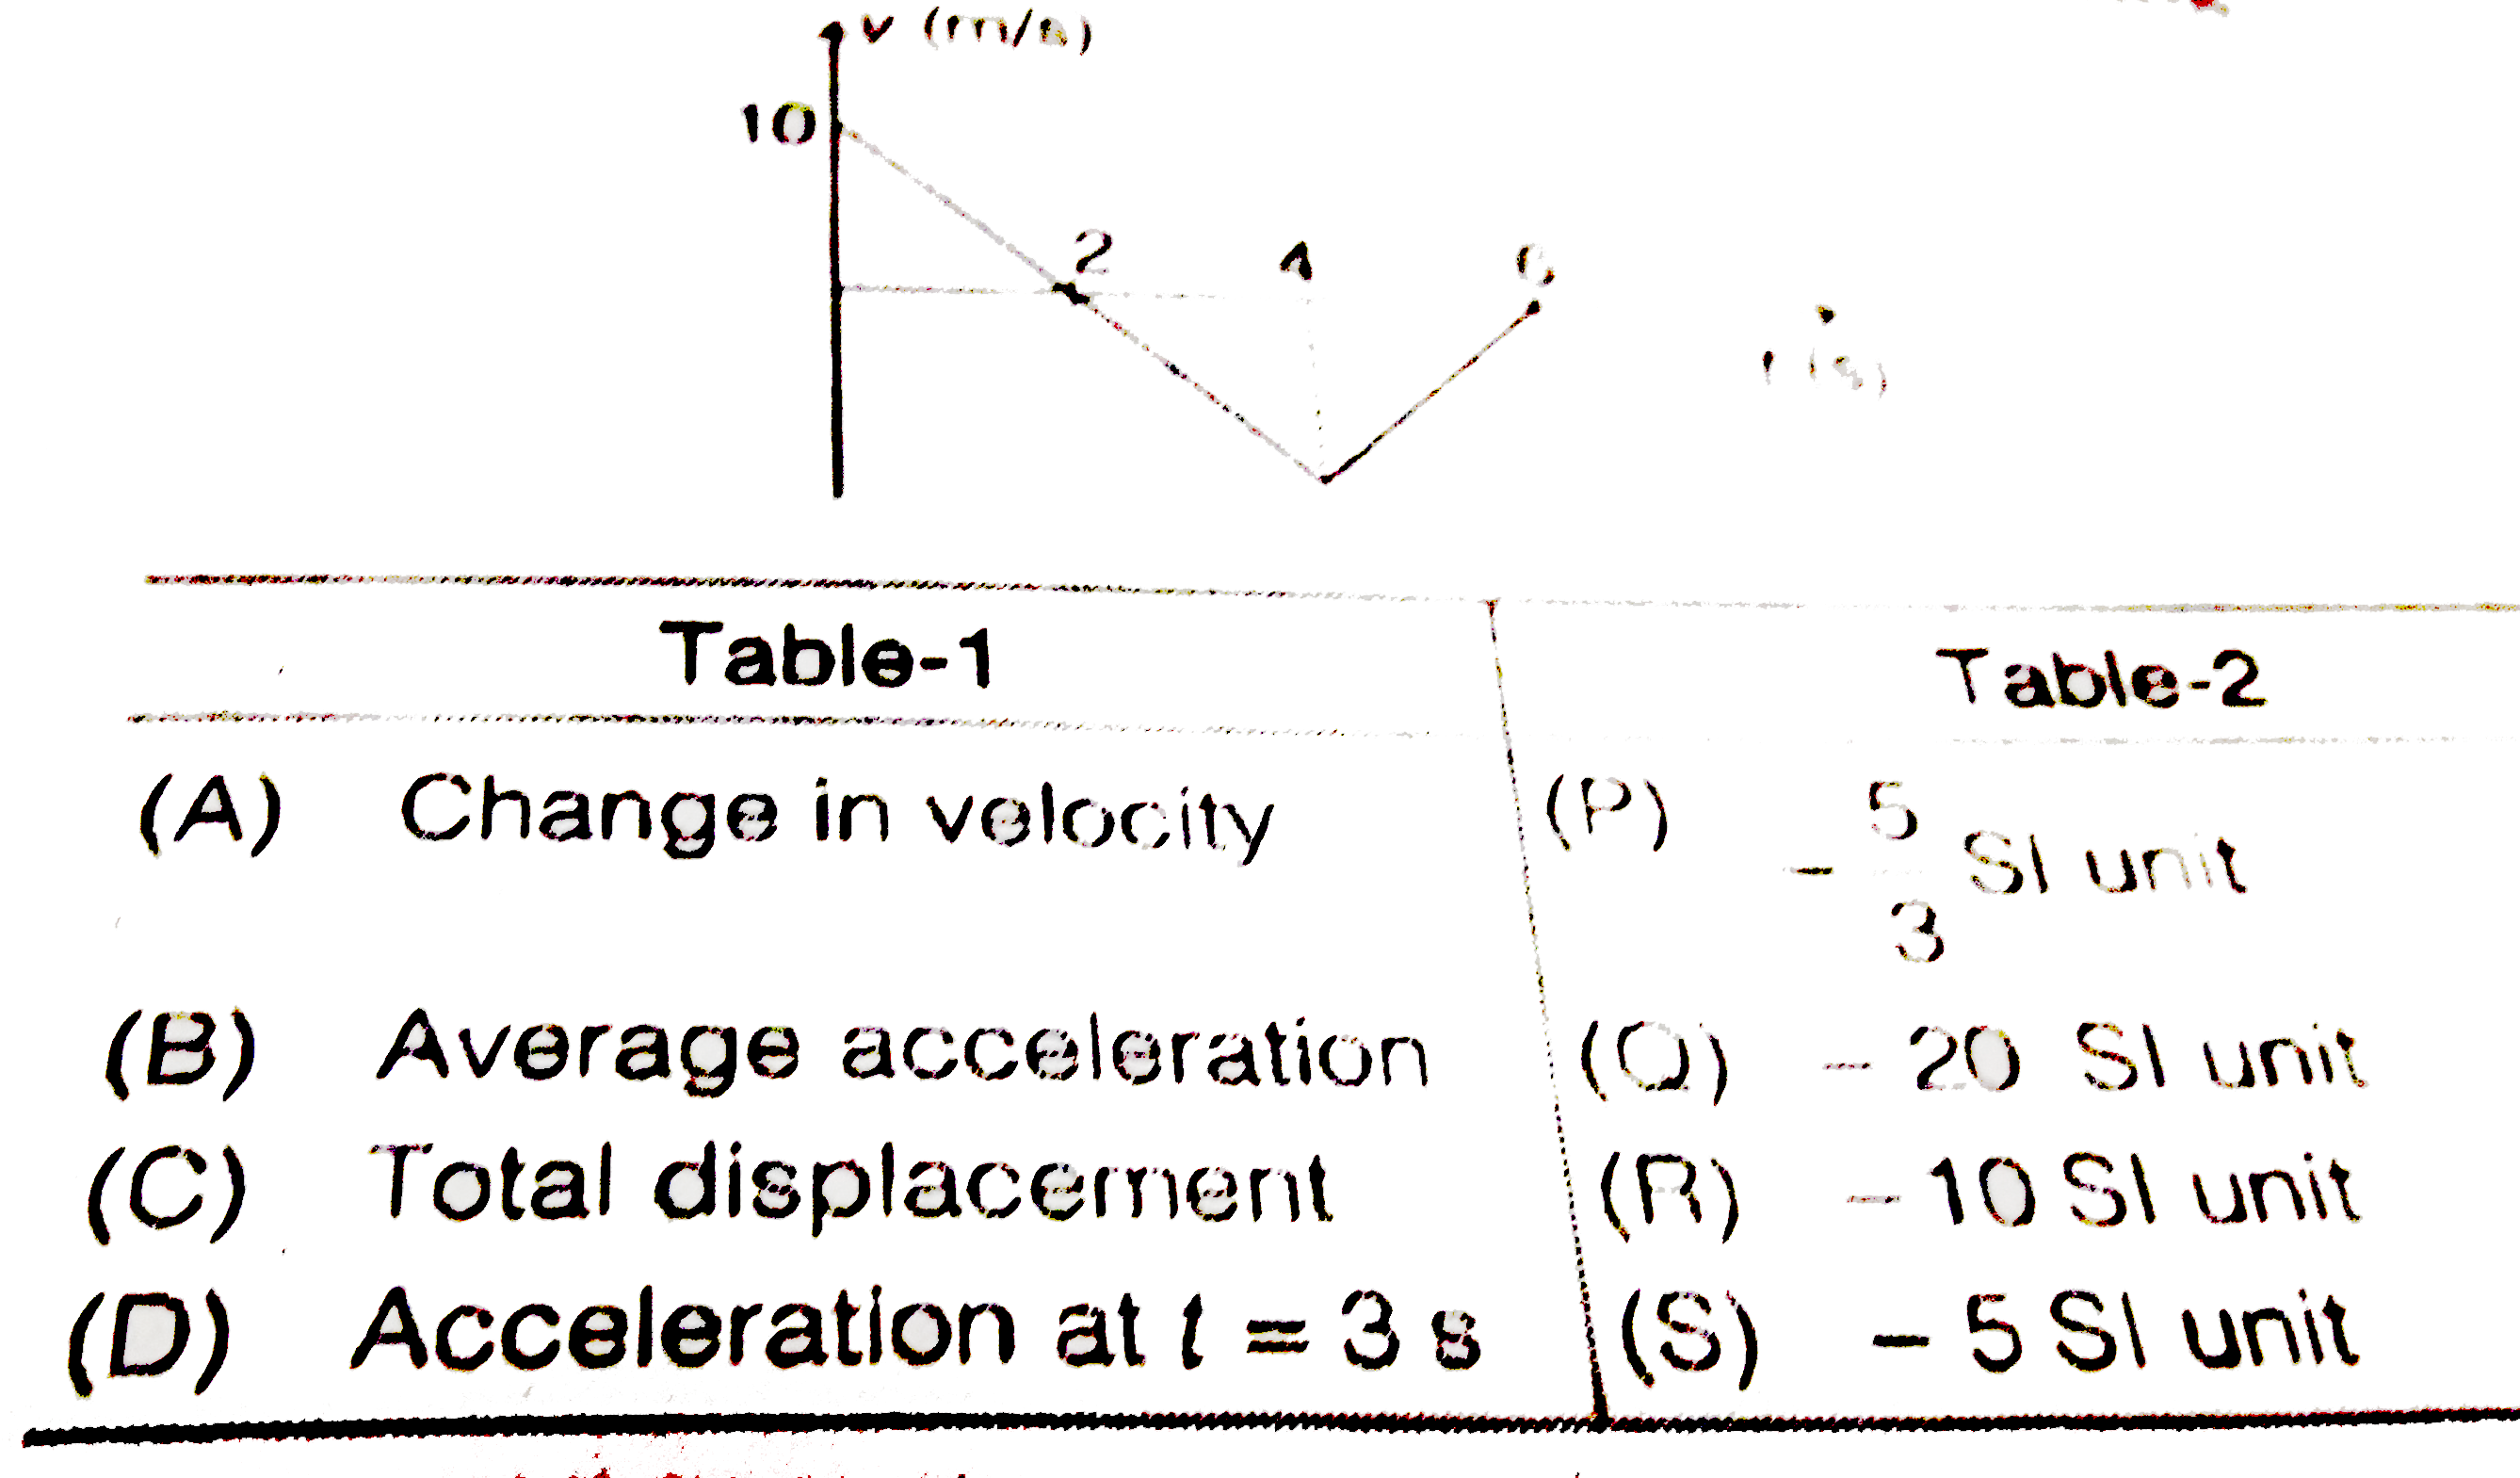
For the velocity time graph shown in figure, in a time interval from t=0 to t=6s match the following
The correct Answer is:(A)-r, (B)-p, (C)-r (D)-s
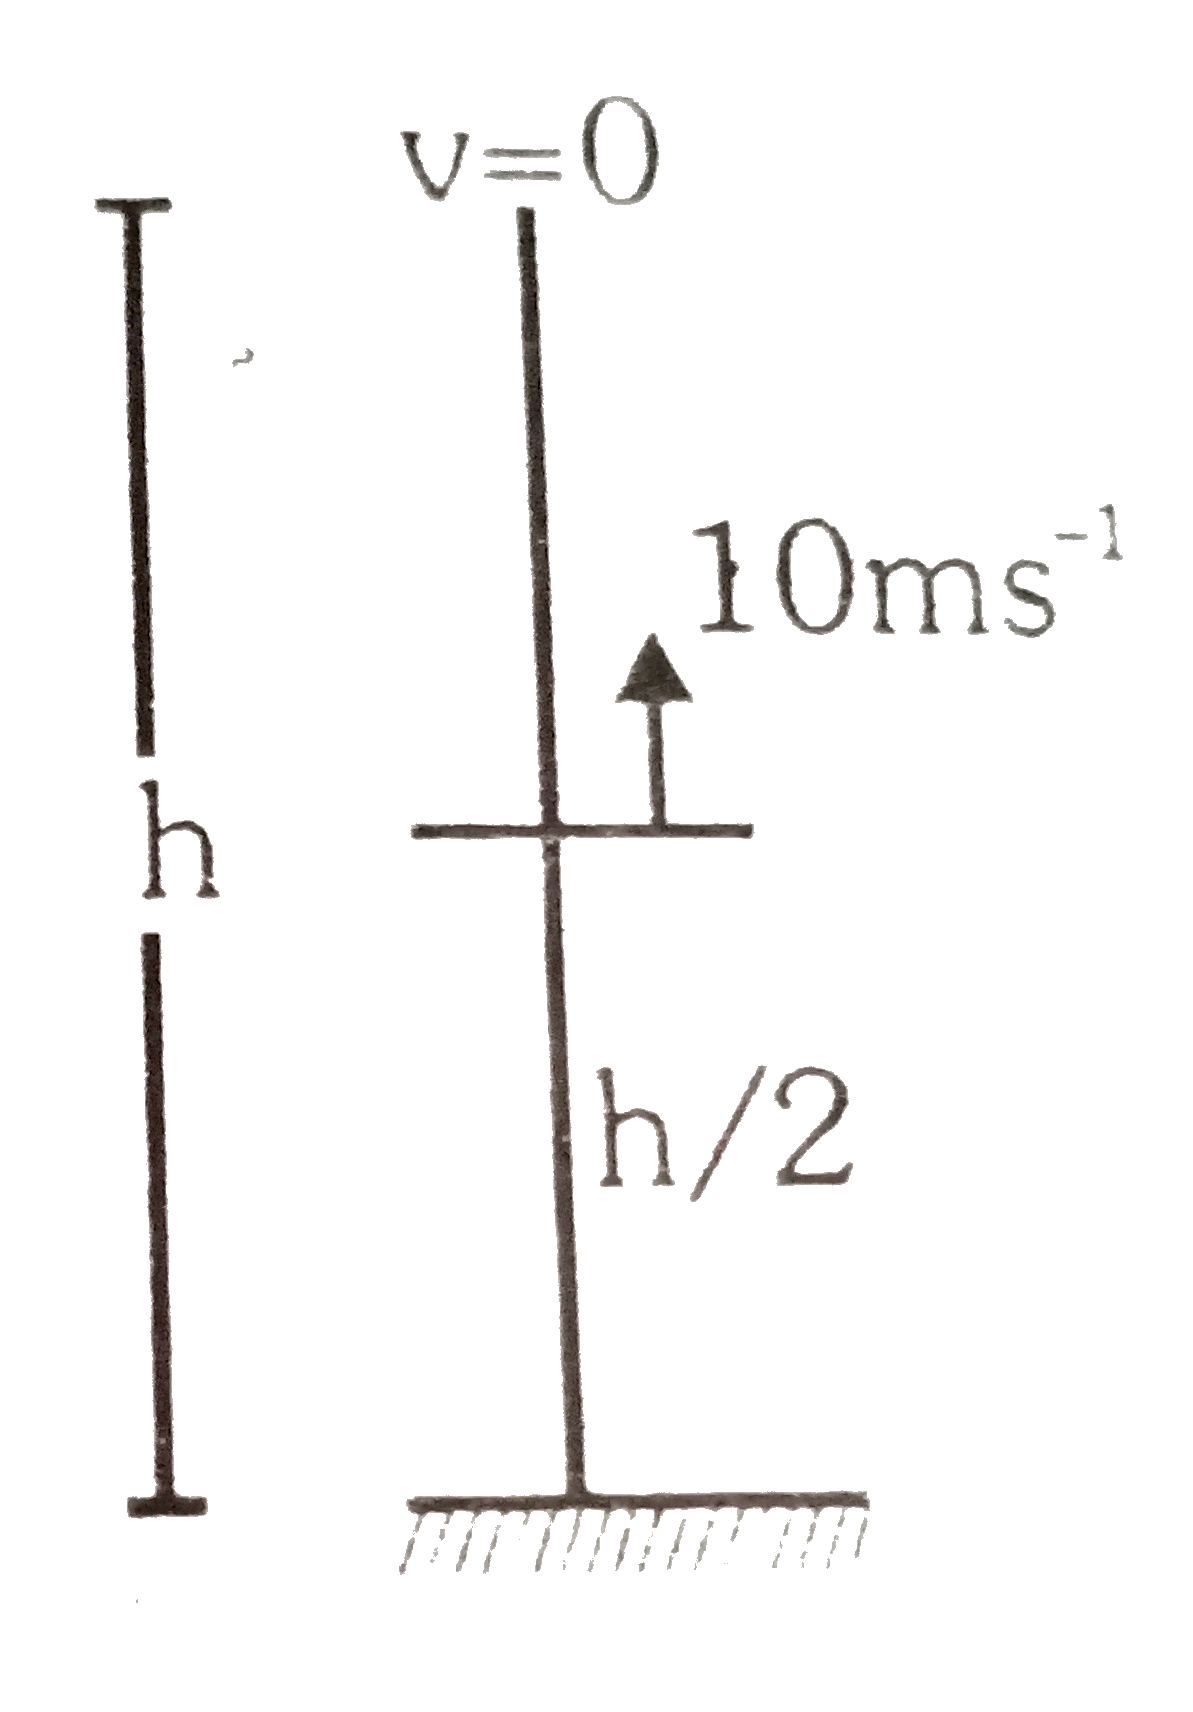
At t=0,v(0)=10m/s,t=0,v(6)=0
Change v(6)−v(0),Δv=0−10=−10m/s
Average acceleration
=charge in velocitytime=−106=−53m/s2
Average velocity =Displacementtime interval
Total displacement = Area of Δ's (with +ve or -ve)
=12×2×10−12×4×10=−10m (units)
∴ Average velocity =−106=−−53m/s
a(3)= slope of line which exist at t=0I0t=4
a=tanθ=−102=−5
Topper's Solved these Questions
- KINEMATICSBOOK - ALLENCHAPTER - KINEMATICSEXERCISE - Assertion-Reason
20 Videos
- KINEMATICSBOOK - ALLENCHAPTER - KINEMATICSEXERCISE - Comprehension#1
3 Videos
- KINEMATICSBOOK - ALLENCHAPTER - KINEMATICSEXERCISE - EXERCISE-02
57 Videos
- ERROR AND MEASUREMENTBOOK - ALLENCHAPTER - ERROR AND MEASUREMENTEXERCISE - Part-2(Exercise-2)(B)
22 Videos
- KINEMATICS (MOTION ALONG A STRAIGHT LINE AND MOTION IN A PLANE)BOOK - ALLENCHAPTER - KINEMATICS (MOTION ALONG A STRAIGHT LINE AND MOTION IN A PLANE)EXERCISE - BEGINNER S BOX-7
8 Videos
Similar Questions
For the velocity -time graph shown in figure, in a time interval from t=0 to t=6s, match the following:
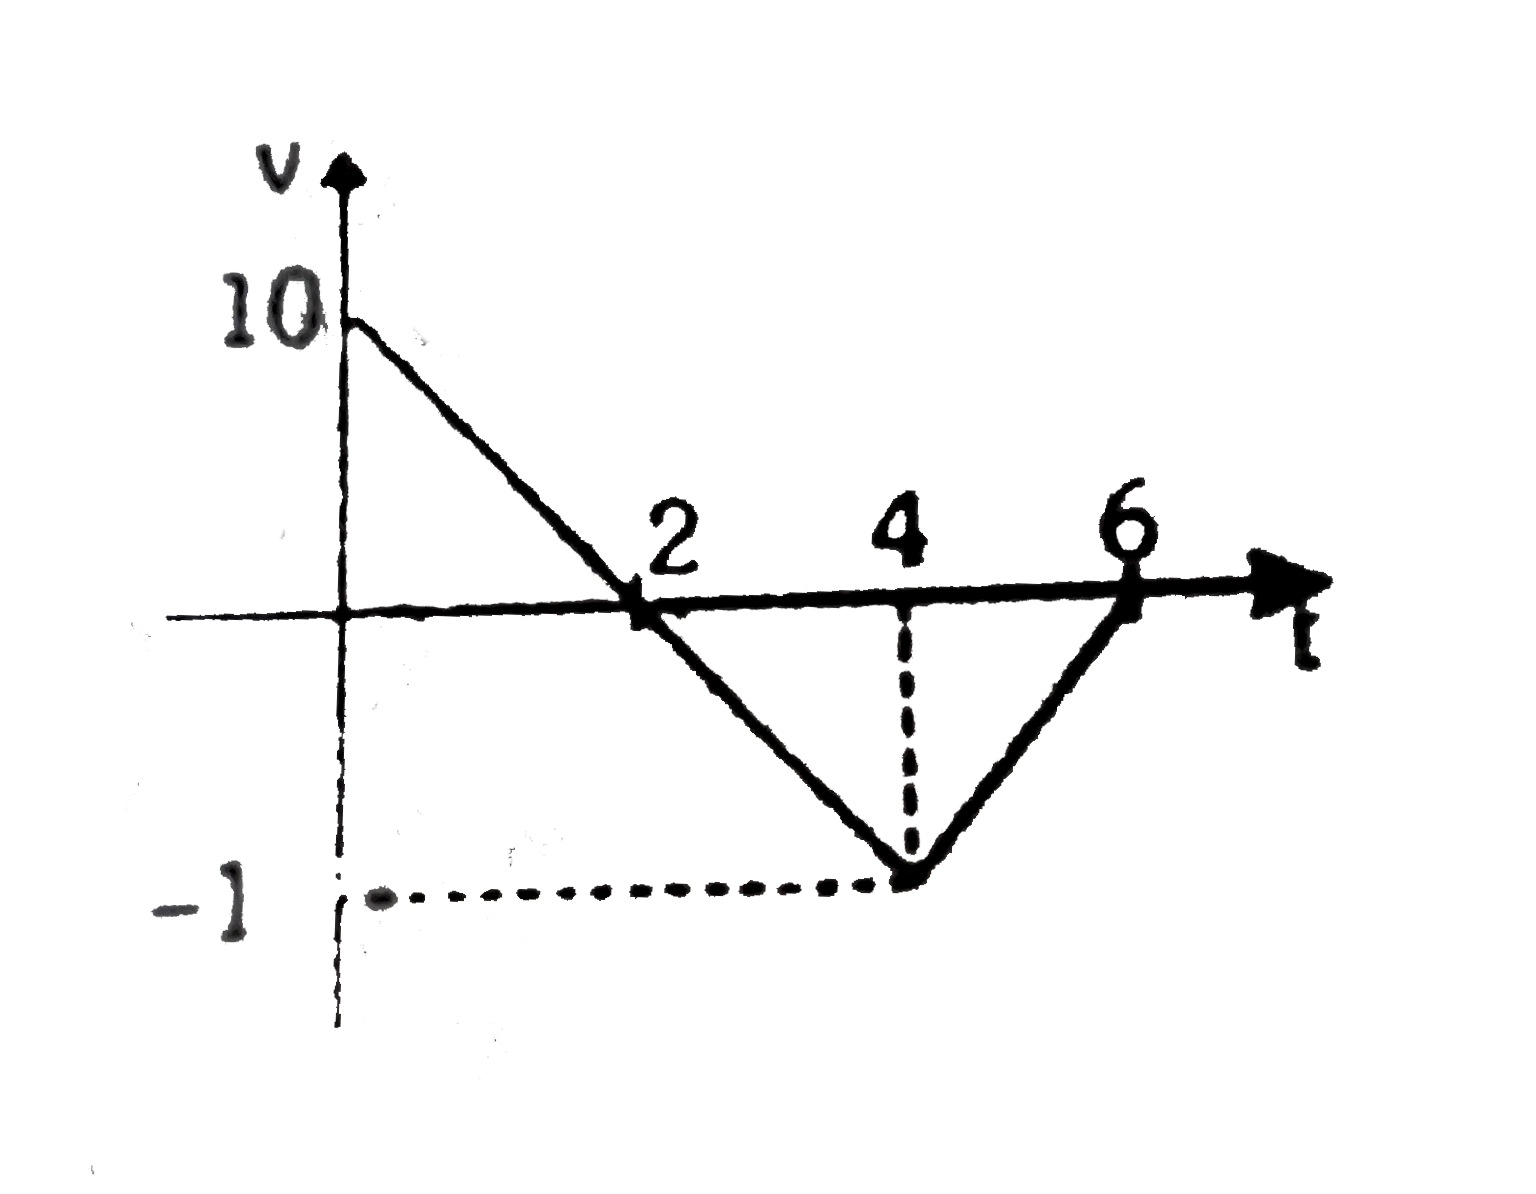
Column IColumn II(A)Change in velocity(p)−5/3SIunit(B)Average acceleration(q)−20SIunit(C)Total displacement(r)−10SIunit(D)Acceleration ay t=3s(s)−5SIunit
View SolutionThe velocity time graph of a particle moving along a straight line is shown in the figure. In the time interval from t=0 to t=8 second, answer the following three question.
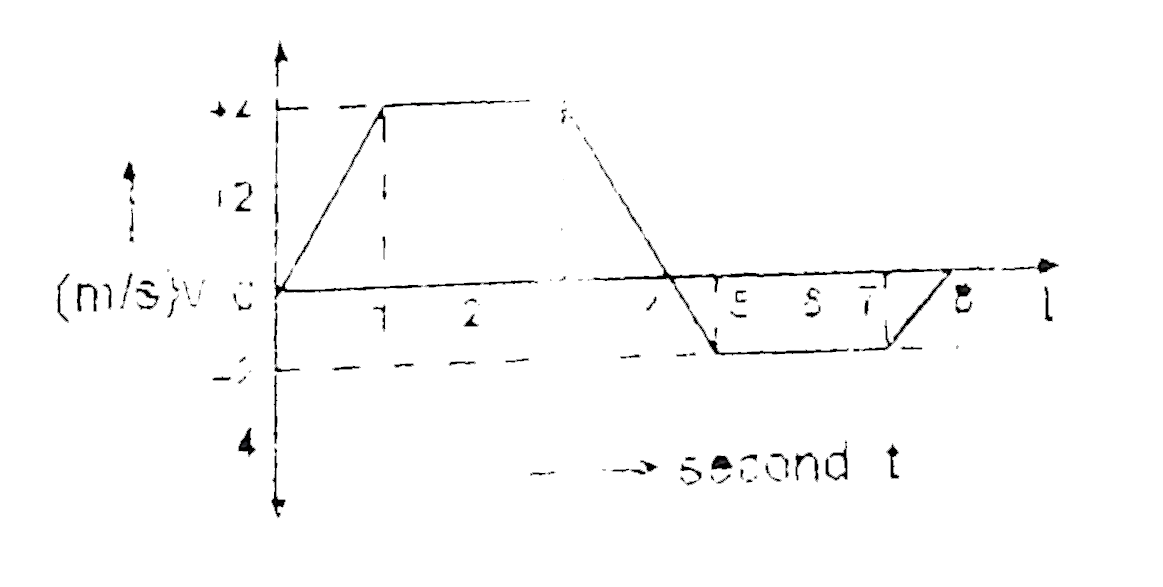
The distance travelled by the particle is :
View SolutionThe velocity time graph of a particle moving along a straight line is shown in the figure. In the time interval from t=0 to t=8 second, answer the following three question.
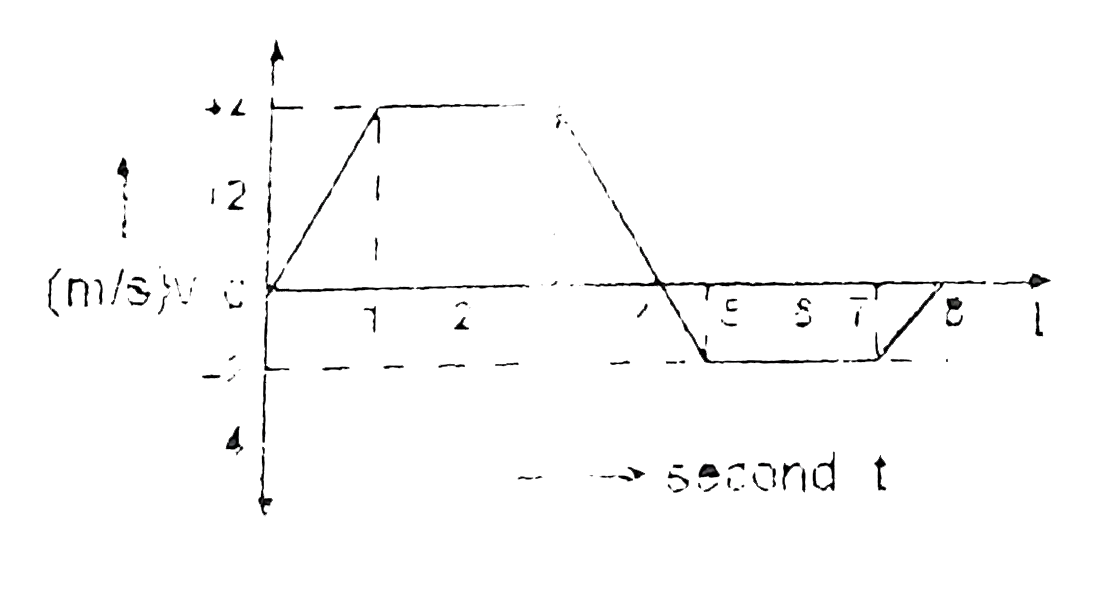
The value of magnitude of maximum velocitymagnitude of average velocity for the given time interval is :
View SolutionThe velocity time graph of a particle moving along a straight line is shown in the figure. In the time interval from t=0 to t=8 second, answer the following three question.
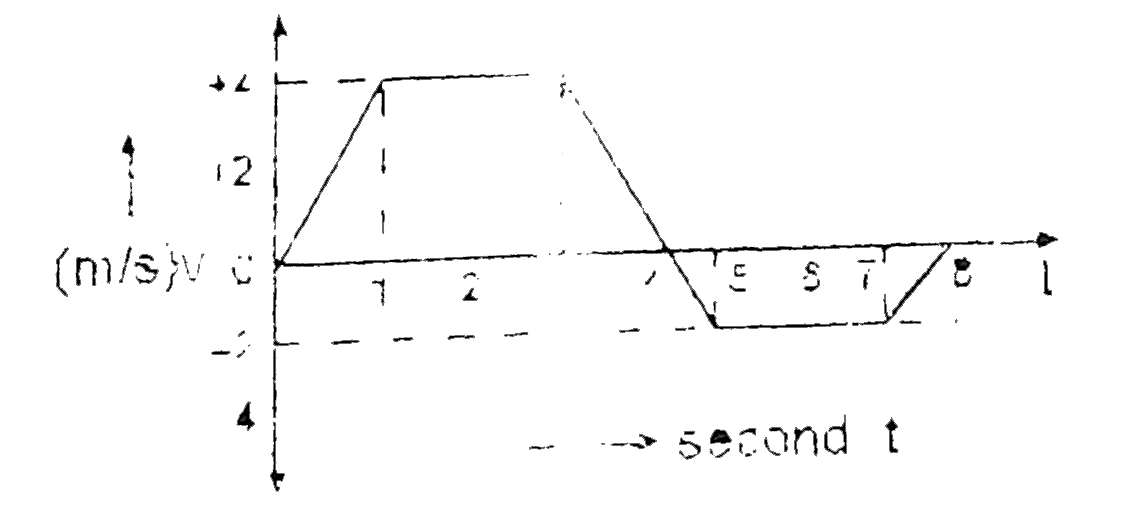
The value of maximum speedaverage speed for the given time interval is :
View SolutionIn the ρ-T graph shown in figure, match the following.
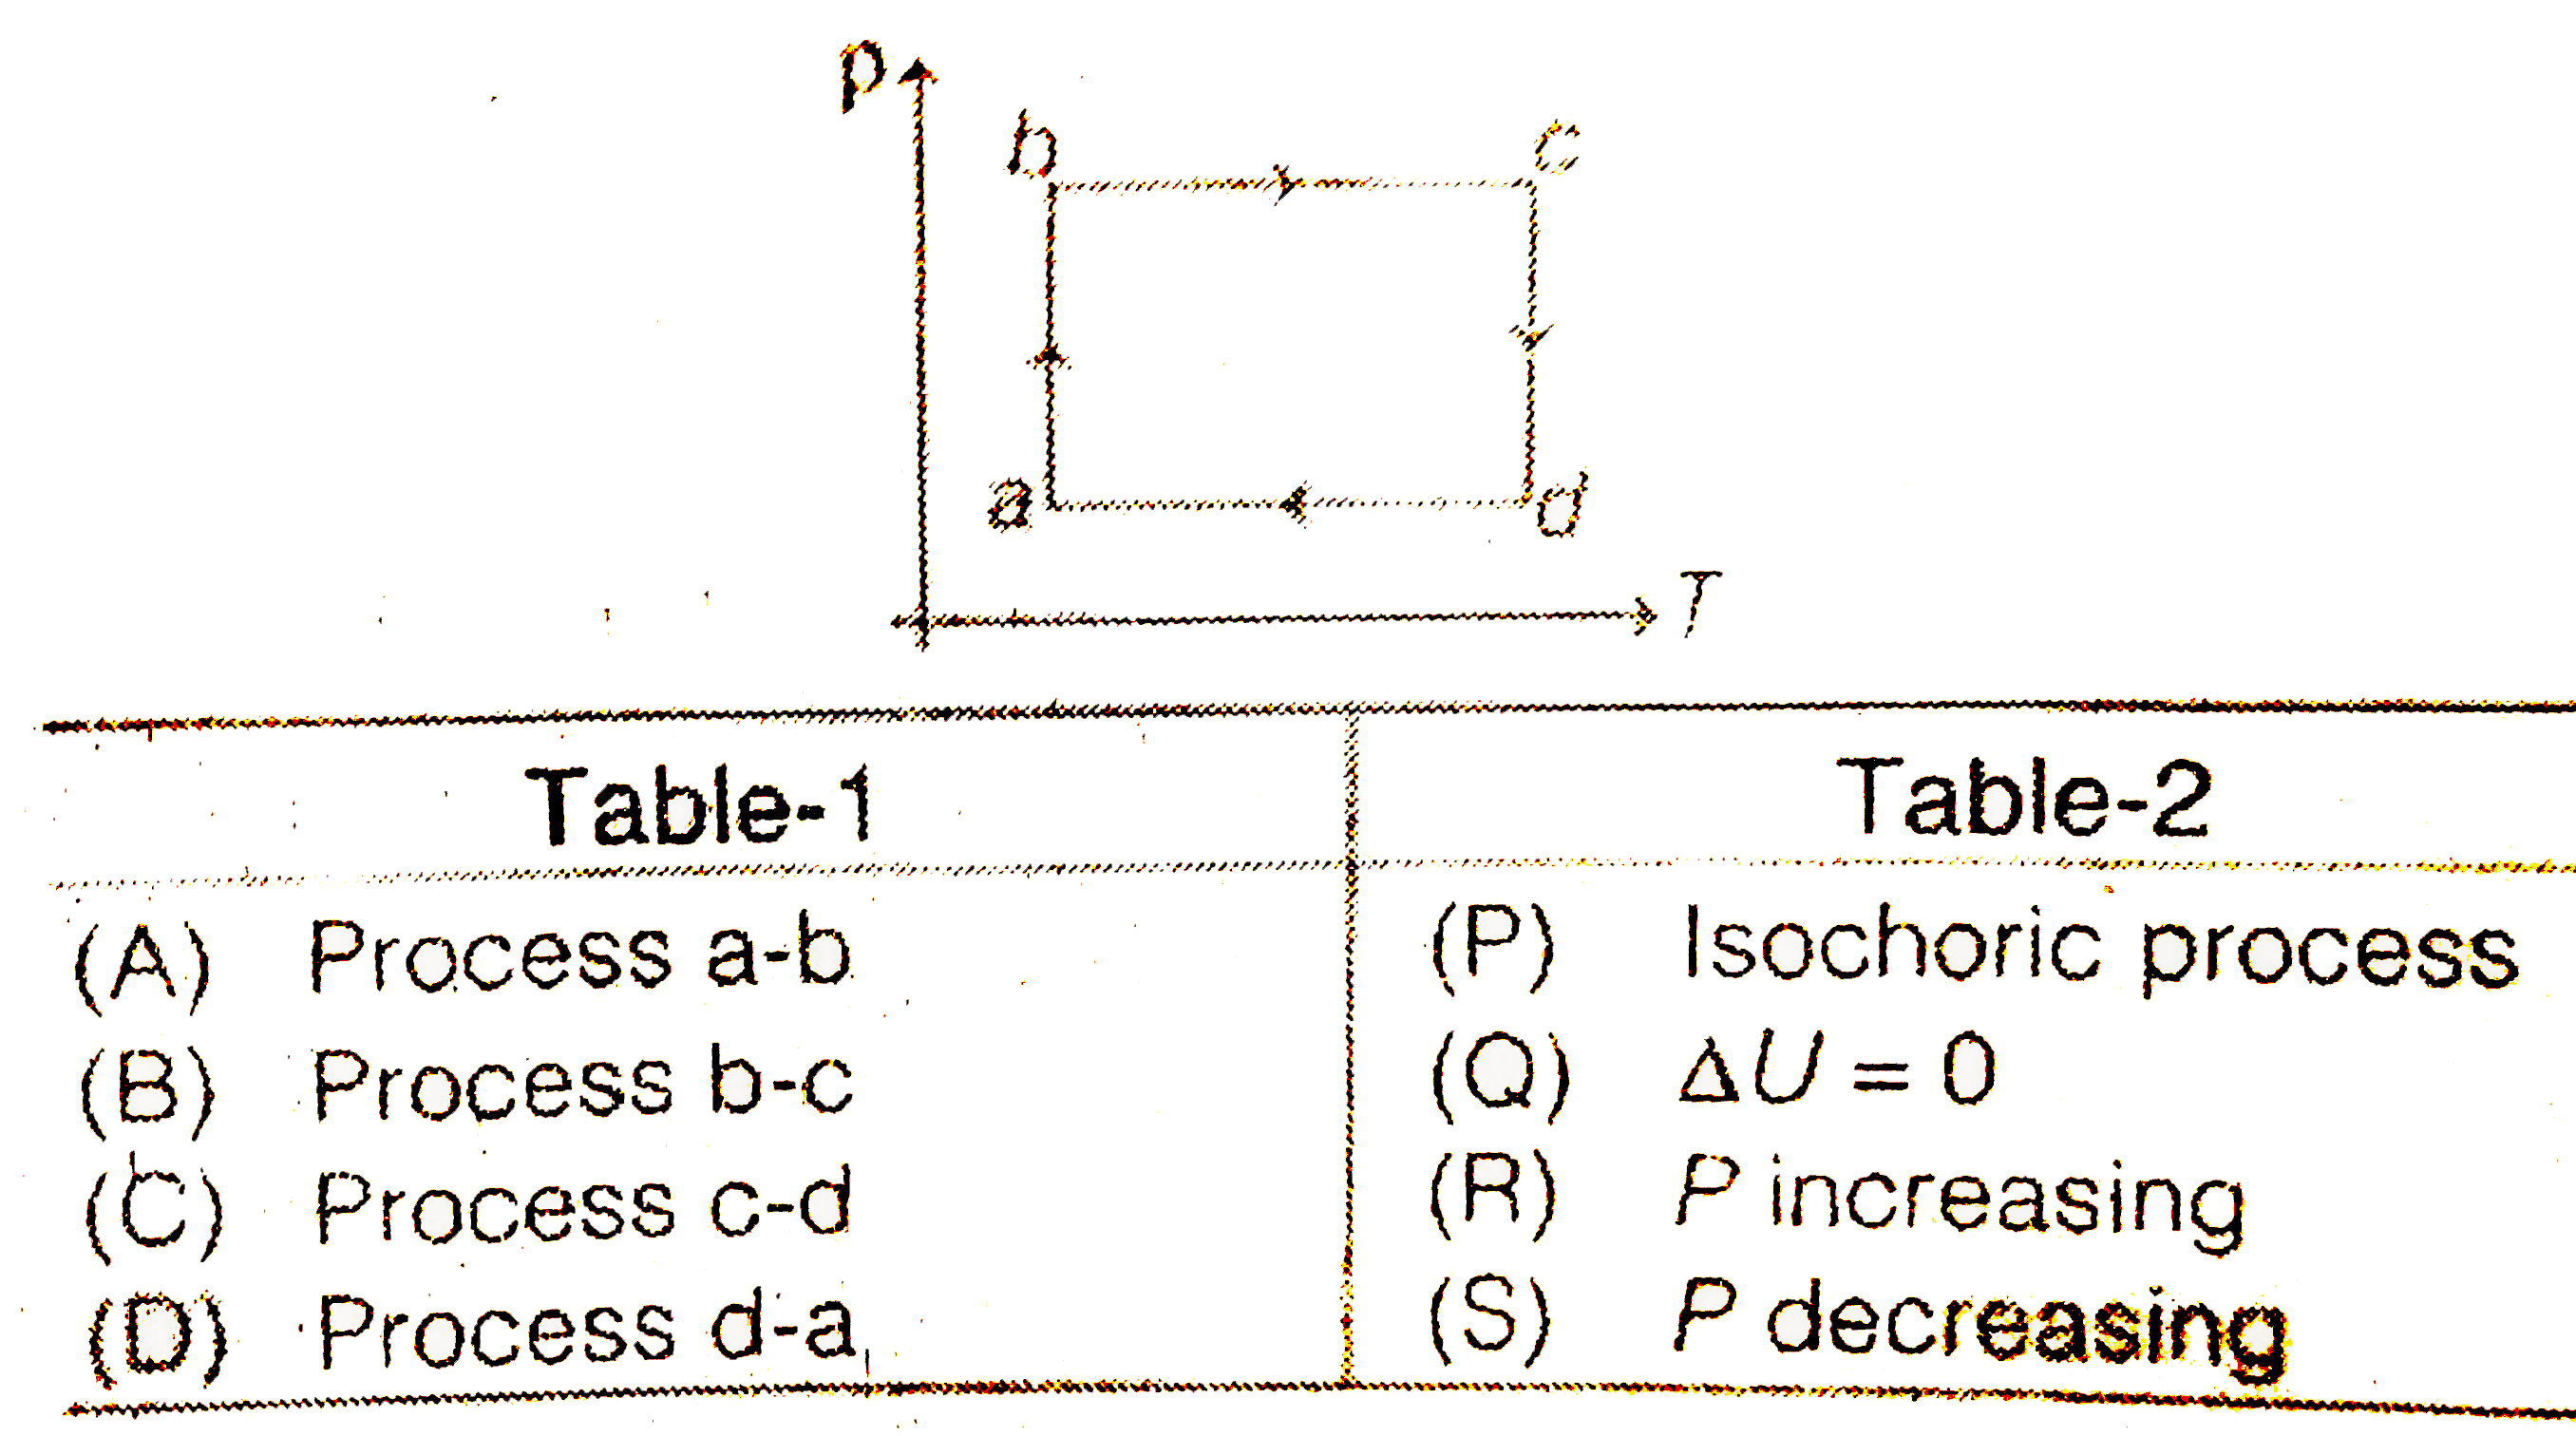
View SolutionVelocity-time graph of a particle moving in a straight line is shown in figure. In the time interval from t=0 to t=14s, find
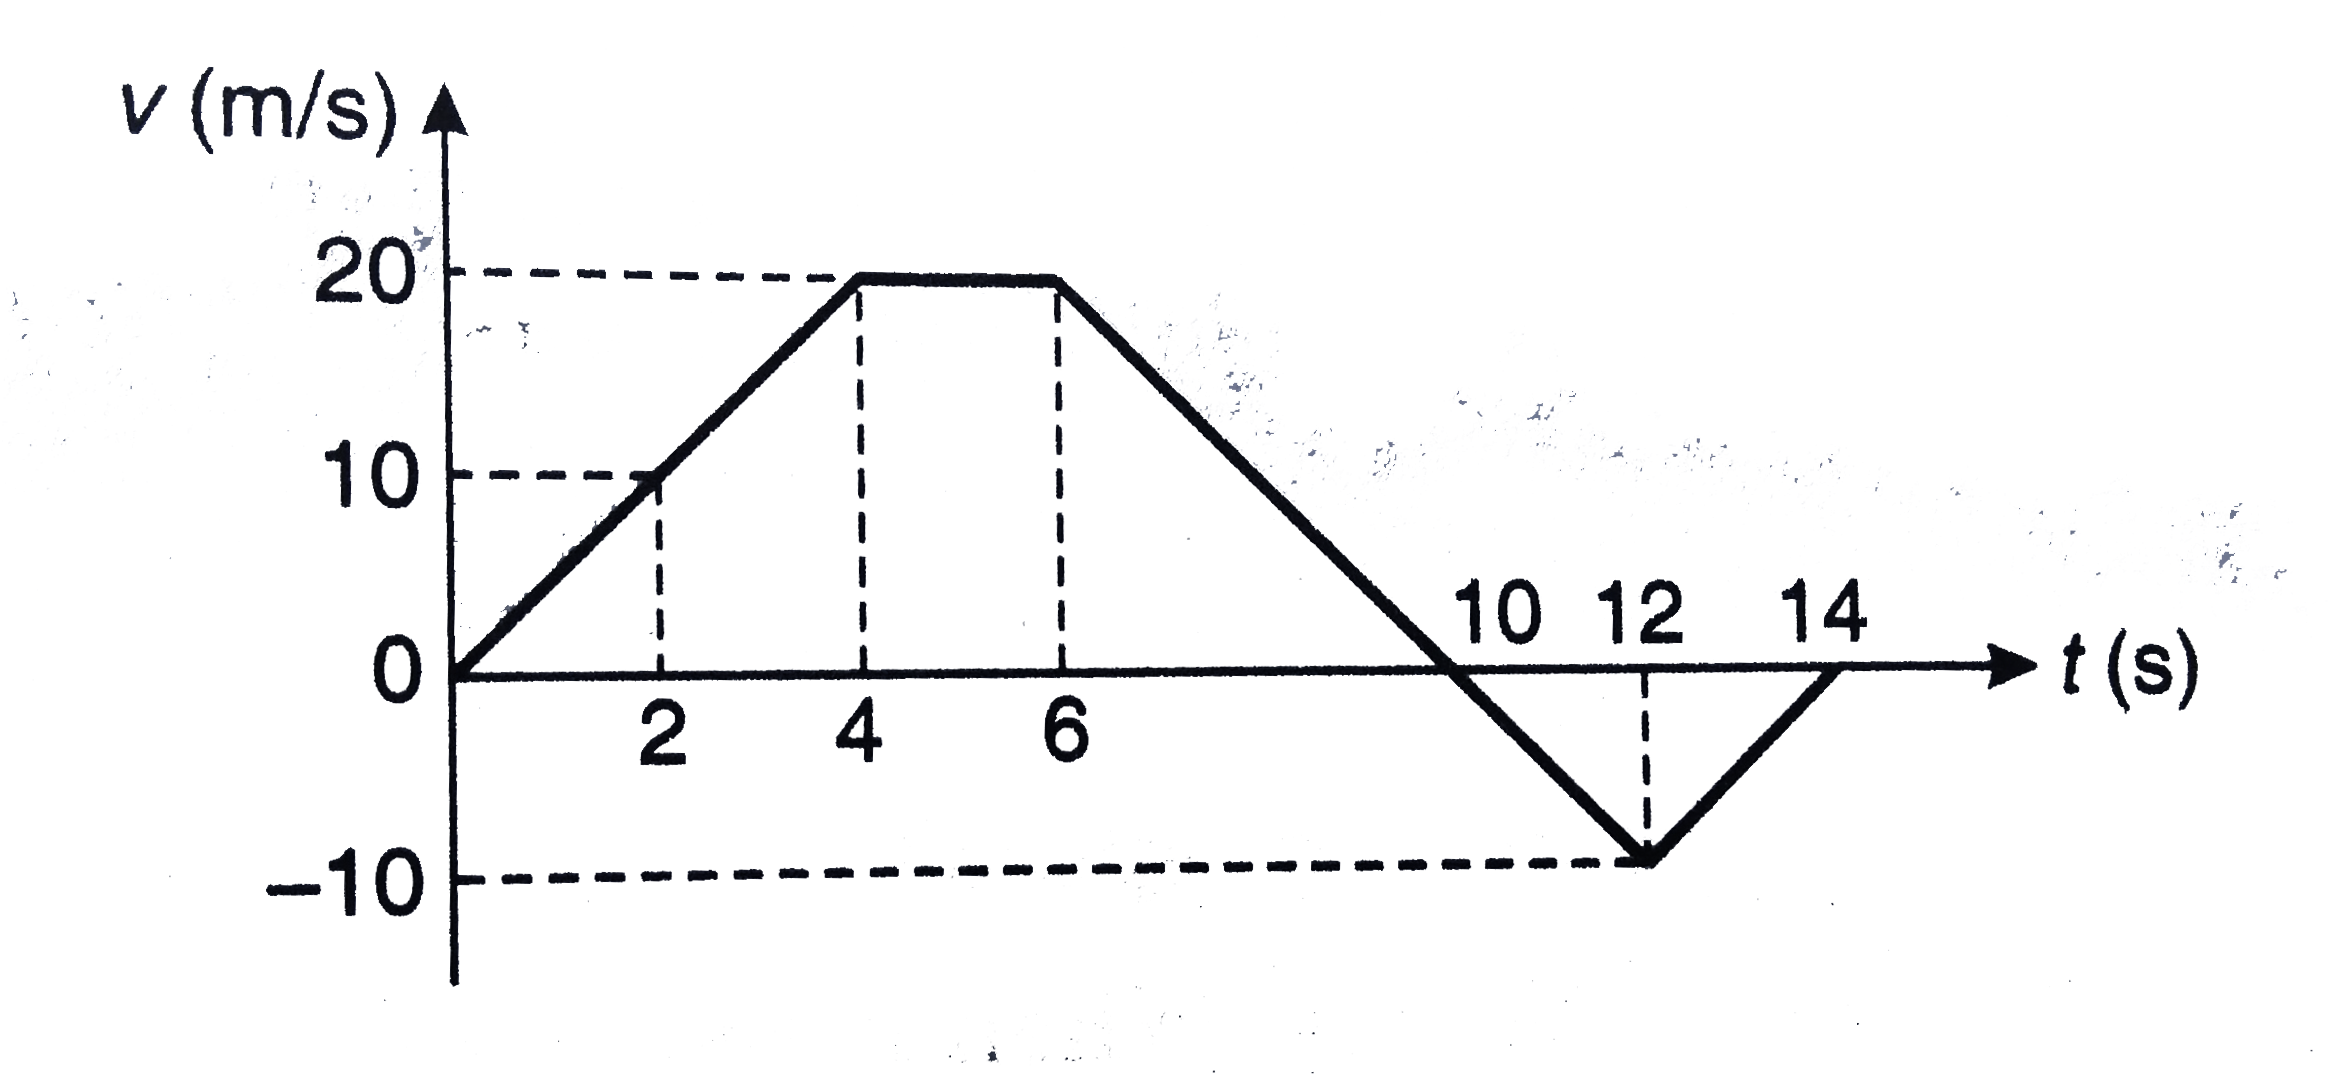
(a) average velocity and
(b) average speed of the particle.
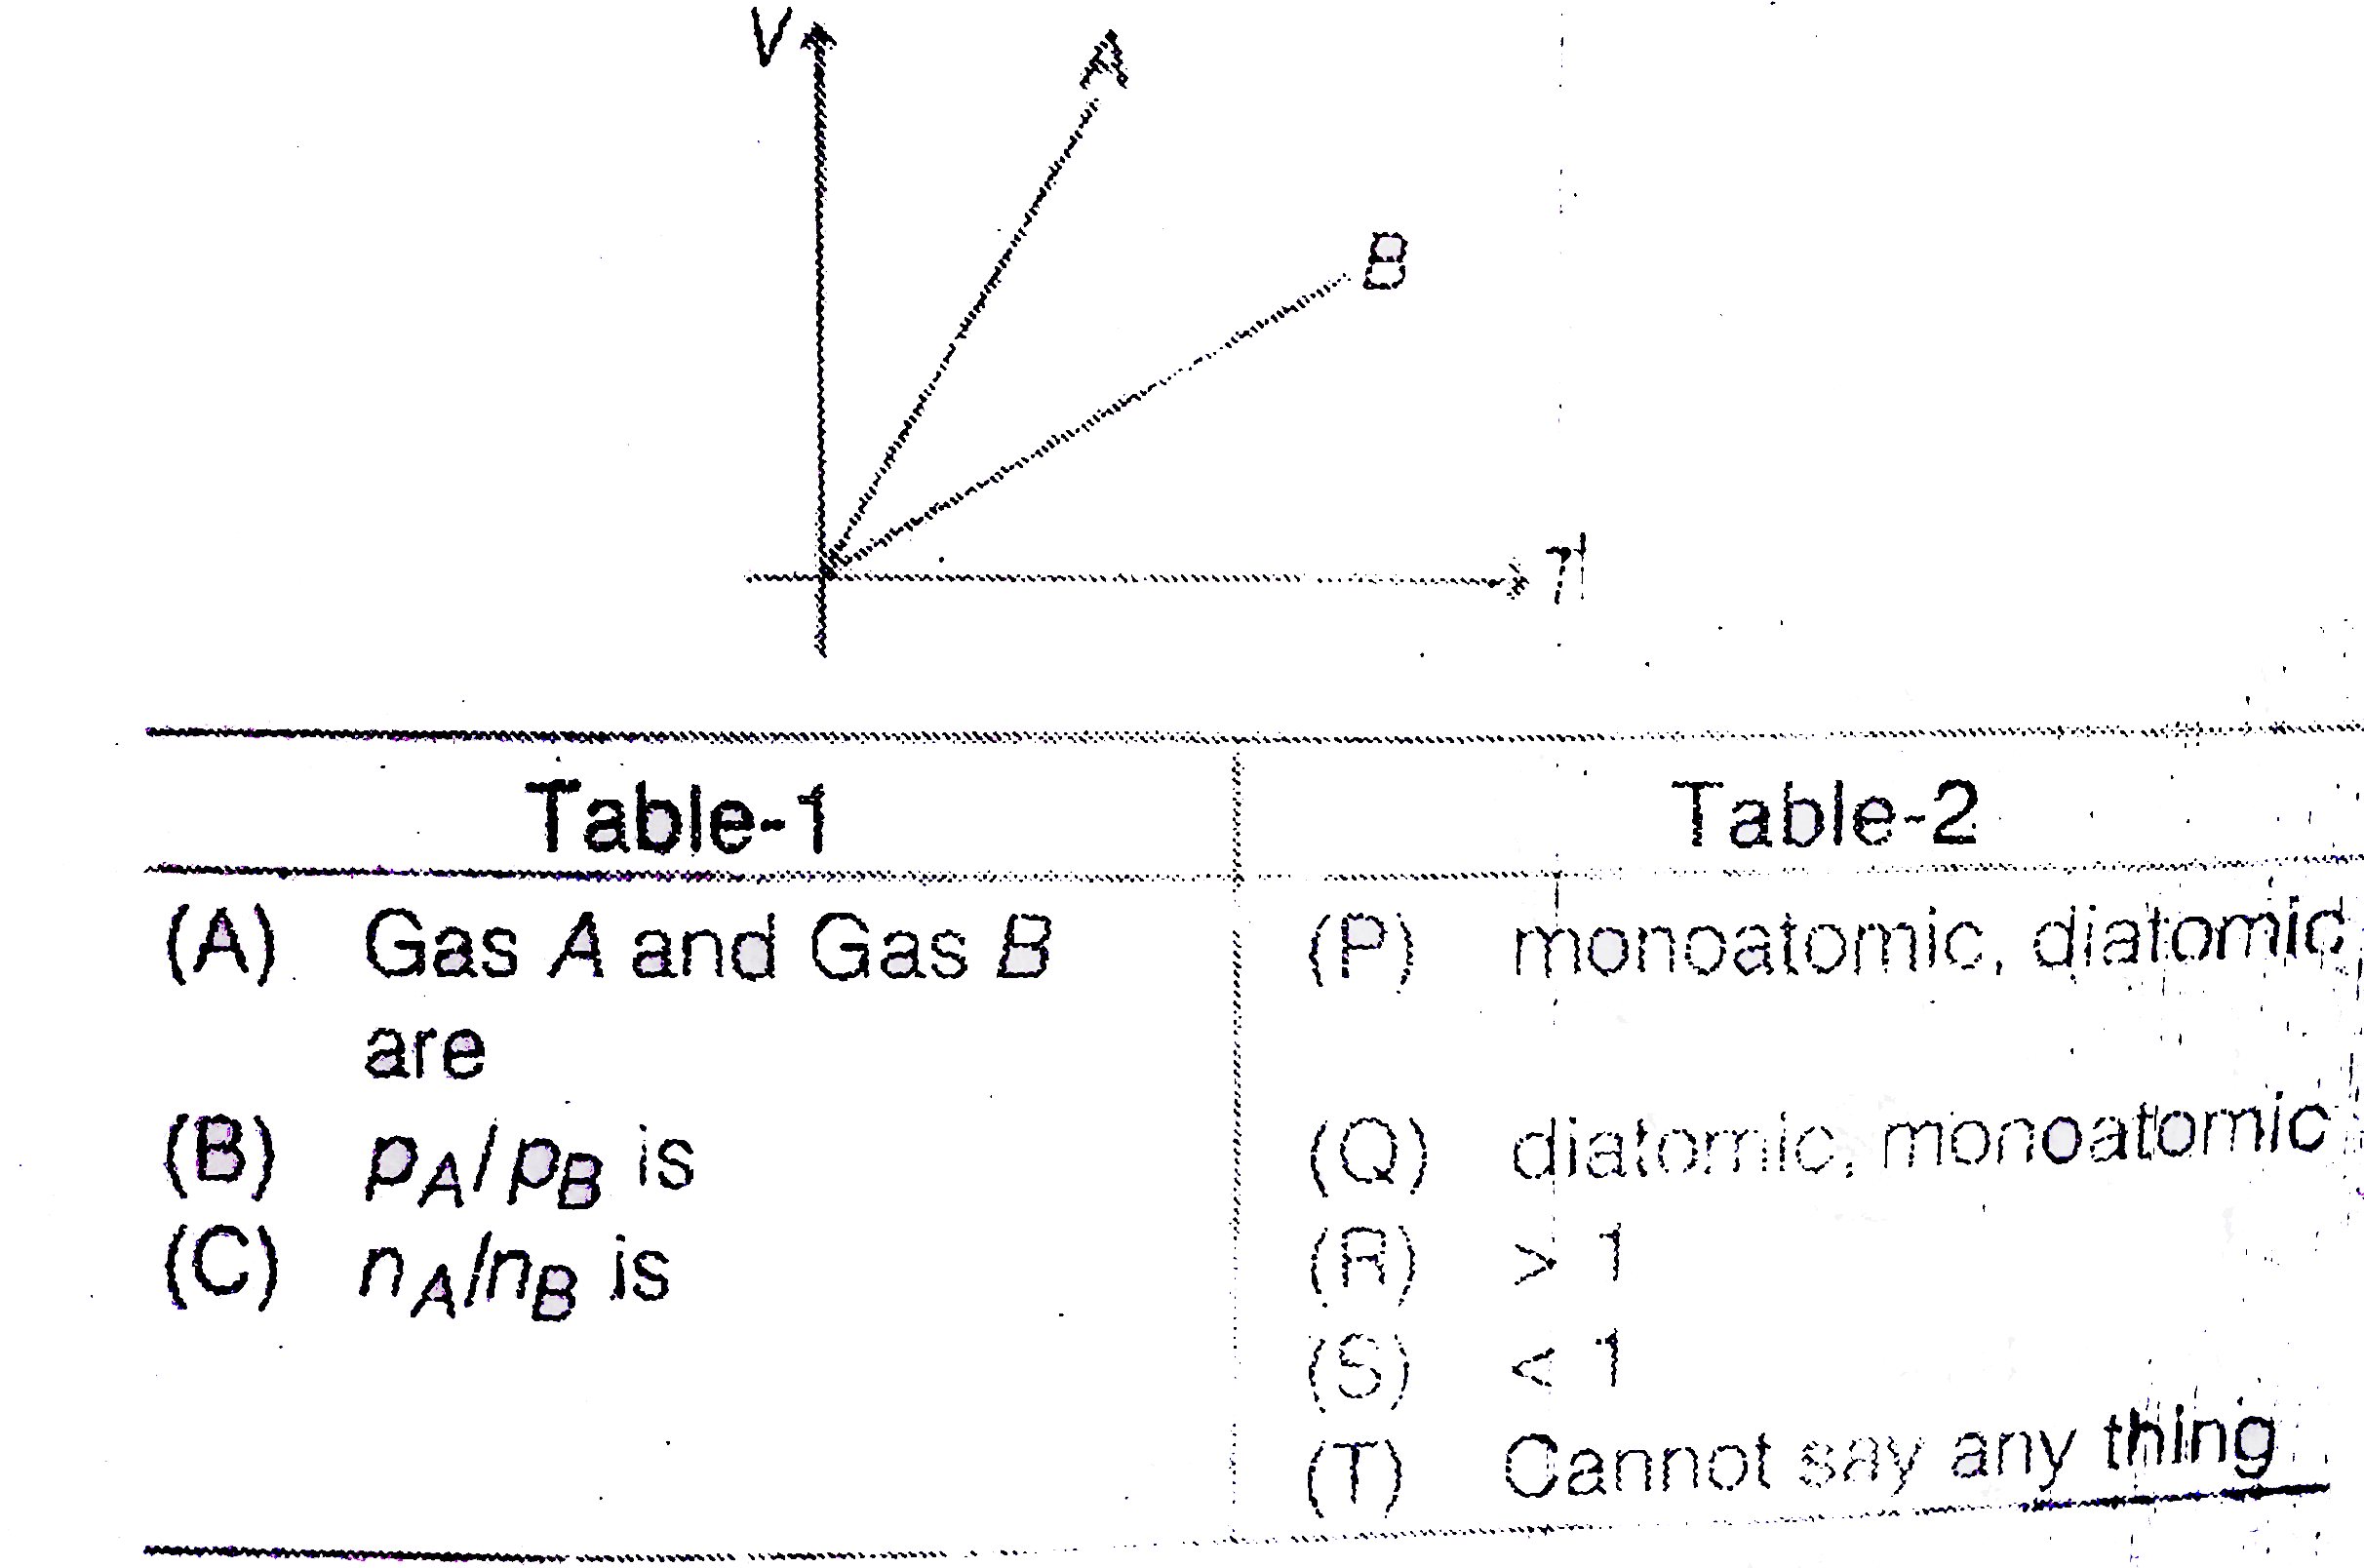
View SolutionIn the V-T graph shown in figure match the following.
View SolutionThe velocity − time graph of a particle is as shown in figure

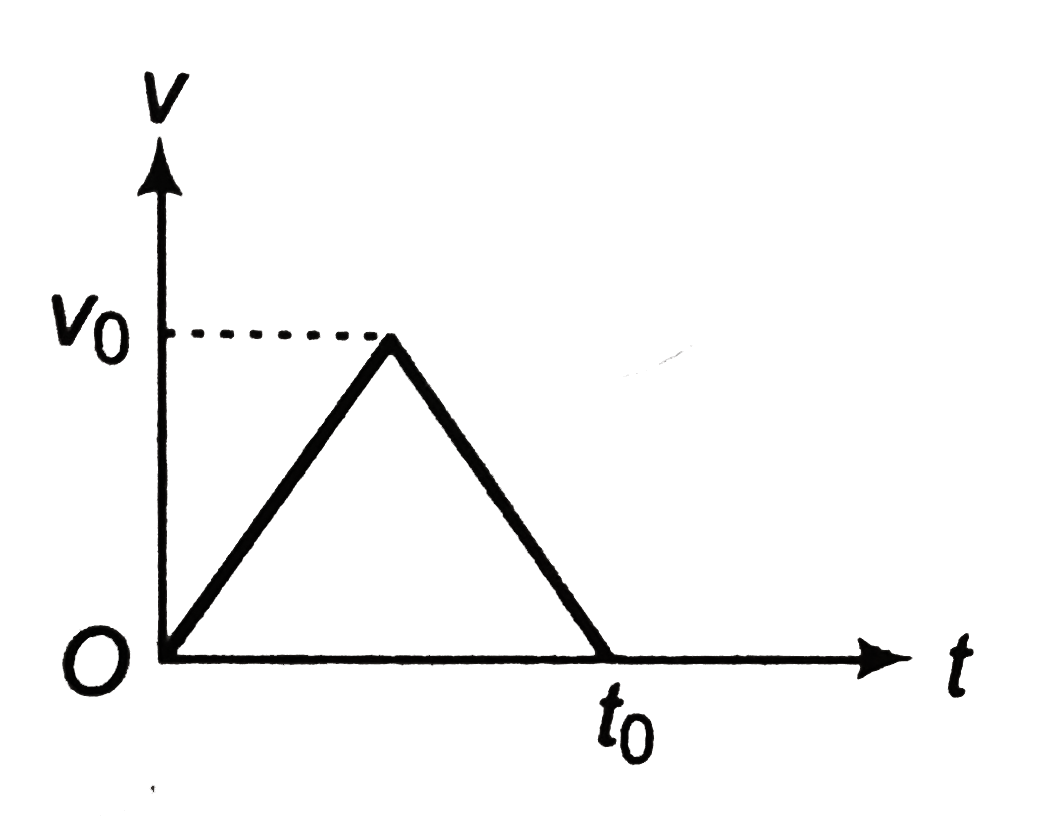
View SolutionAssertion : In v-t graph shown in figure, average velocity in time interval from 0→t0 depends only on v0. It is independent of t0.
Reason : In the given time interval average velocity is v02.
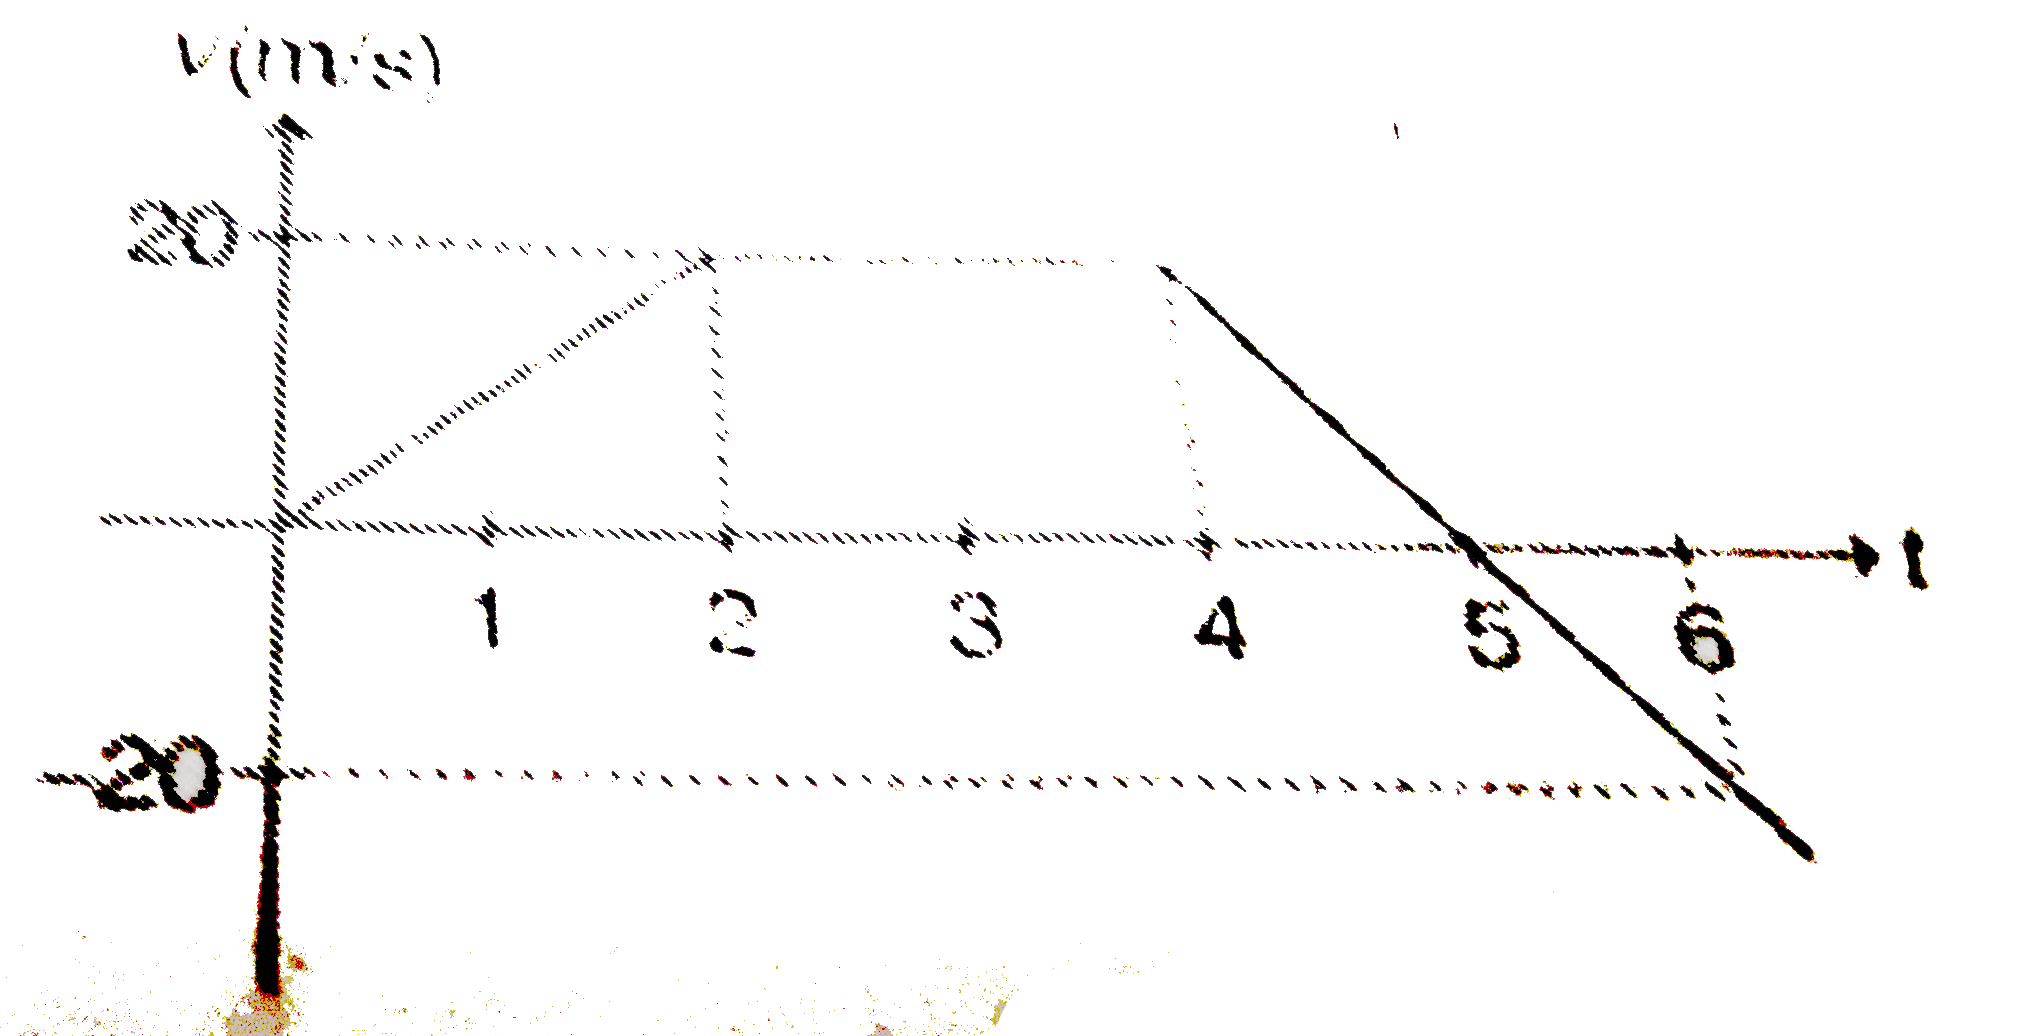
View SolutionFigure shows the velocity time graph for a particle travelling along a straight line. The magnitude of average velocity (in m/s) of particle during the time interval from t=0 to t=6s is 10α. Find the value of α.
View Solution
