टेलीविज़न सेटों की वर्ष-दर-वर्ष बिक्री में वृद्धि का प्रतिशत
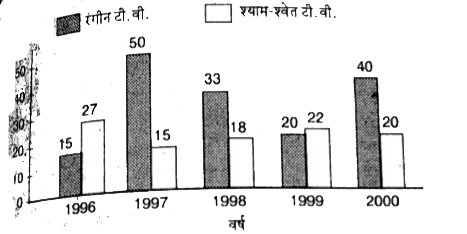
1999 रंगीन तथा श्वेत-श्याम टी.वी. की बेची गयी संख्याओं में 5 : 3 का अनुपात था । वर्ष 2000 के अन्त में दोनों प्रकार के टी.वी.की बेची गयी संख्याओं का अनुपात क्या था?
10:9
6:5
20:17
35:18
The correct Answer is:D
Step by step video, text & image solution for टेलीविज़न सेटों की वर्ष-दर-वर्ष बिक्री में वृद्धि का प्रतिशत 1999 रंगीन तथा श्वेत-श्याम टी.वी. की बेची गयी संख्याओं में 5 : 3 का अनुपात था । वर्ष 2000 के अन्त में दोनों प्रकार के टी.वी.की बेची गयी संख्याओं का अनुपात क्या था? by Maths experts to help you in doubts & scoring excellent marks in Class 14 exams.
Updated on:21/07/2023Topper's Solved these Questions
- ग्राफBOOK - MAHESH MISHRACHAPTER - ग्राफEXERCISE - 29 B प्रतियोगी परीक्षाओं में पूछे गए प्रश्न
74 Videos
- क्रमचय और संचयBOOK - MAHESH MISHRACHAPTER - क्रमचय और संचयEXERCISE - 26 C (प्रतियोगी परीक्षाओं हेतु अभ्यास प्रश्नमाला)
35 Videos
- घातांक एंव करणीBOOK - MAHESH MISHRACHAPTER - घातांक एंव करणीEXERCISE - 4 C (प्रतियोगी परीक्षाओं हेतु अभ्यास प्रश्नमाला)
90 Videos
Similar Questions
दो कम्पनियोंA और B का विभिन्न वर्षों में शुद्ध लाभ का प्रतिशत
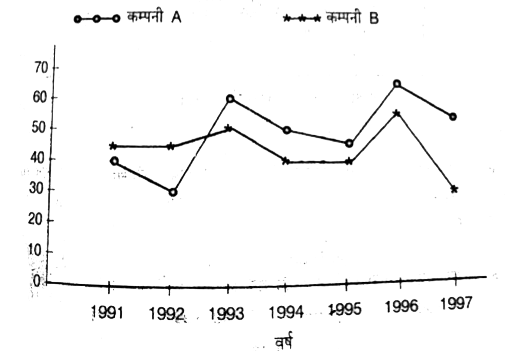
यदि 1992 में कम्पनी B की कुल आय 140 करोड़ रुपये थी, तब उस वर्ष उसका कुल खर्च (करोड़ रुपये में) क्या था ?
View Solution8 छात्र गणित विषय के, 7 छात्र विज्ञान के तथा 4 छात्र अंग्रेजी विषय के है। कितने तरीके से इन छात्रों को स्कॉलरशिप दिए जा सकते हैं यदि यह सर्वोच्च स्थान प्राप्त करनेवालों को ही दिया जाता है ?
View Solution81√0.04=?
View SolutionMatch the following Column A to Column B

View SolutionThe following line diagram represents the yearly sales figure of a company in the years 2001-2010. Examine the diagram and answer the question. निम्नलिखित रेखा आरेख किसी कंपनी की वर्ष 2007-2010 के दौरान वार्षिक बिक्री के आंकड़ों को दर्शाता है। आरेख का अध्ययन करें और नीचे दिए गए प्रश्नों के उत्तर दें- The ratio of sales in 2002 to that in 2007 is वर्ष 2002 में बिक्री का वर्ष 2007 में बिक्री के साथ अनुपात है-
View Solution5 years ago, the ratio of the age of A to that of B was 4:5. Five years hence, the ratio of the age of A to that of B will be 6:7. If, at present, C is 10 years younger than B, then what will be the ratio of the present age of A to that of C ?
5 वर्ष पहले, A और B की उम्र का अनुपात 4 : 5 था | अब से 5 वर्ष बाद, A और B की उम्र में 6: 7 का अनुपात होगा | यदि वर्तमान में, C, B से 10 वर्ष छोटा है | तो, A और C की वर्तमान आयु में क्या अनुपात है ?
View SolutionFive year ago, the ratio of the ages of A and B was 3:4. Five years from now, the ratio of their ages will be 4:5. What is the ratio of A and B, 10 years form now ?
पांच साल पहले, A और B की उम्र का अनुपात 3 : 4 था | अजब से पांच वर्ष बाद, उनकी उम्र का अनुपात 4 : 5 हो जाएगा | अब से 10 वर्ष बाद A और B की उम्र में क्या अनुपात होगा?
View SolutionThe ratio of ages of A and B, four years ago, was 7:5. The ratio of their ages, 6 years form now will be 19:15. What is the ratio of the present ages of A and B ?
A और B की उम्र में चार वर्ष पहले 7: 5 का अनुपात था | अब से छः वर्ष बाद उनकी उम्र में 19 : 15 का अनुपात हो जाएगा | A और B की वर्तमान उम्र में क्या अनुपात है ?
View SolutionThe ratio of ages of A and B, 8 years ago, was 2:3. Four years ago, the ratio of their ages was 5:7. What will be the ratio of their ages 8 years from now?
8 वर्ष पहले Aऔर B की उम्र का अनुपात 2 : 3 था | चार वर्ष पहले, उनकी उम्र का अनुपात 5 : 7 था | अब से 8 वर्ष के बाद उनकी उम्र का अनुपात क्या होगा ?
View SolutionThe table shows the number of cars sold by three showrooms over a period of six years. यह तालिका तीन शोरूम द्वारा छः वर्षों की अवधि में बेची गयी कारों की संख्या दर्शाती है | By what percent did the total number of cars sold by all three showrooms decrease during the year 2016, as compared to that in the year 2015 (nearest to one decimal place)? वर्ष 2015 की तुलना में वर्ष 2016 में तीनों शोरूम के द्वारा बेची गयी कारों की कुल संख्या में कितने प्रतिशत की कमी आयी है ? (एक दशमलव स्थान के निकटतम )
View SolutionThe given Bar Graph presents the sales of the number of books (in thousands) by six benches of a publishing company during two consecutive years 2000 and 2001. दिया गया दंड आरेख लगातार दो वर्षों : 2000 और 2001 में एक प्रकाशन कंपनी की छः शाखाओं के द्वारा बेची गयी पुस्तकों की संख्या ( हज़ार में ) दर्शाता है | The ratio of total sales by all branches for the year 2001 to total sales by all branches for the year 2000 is: वर्ष 2001 में सभी शाखाओं की कुल बिक्री का वर्ष 2000 में सभी शाखाओं की कुल बिक्री के साथ अनुपात ज्ञात करें|
View SolutionThe bar graph given below presents the number of books sold by a bookseller during different months of a year.
नीचे दिया गया दंड आरेख एक पुस्तक विक्रेता के द्वारा किसी वर्ष के अलग-अलग महीनों में बेची गयी पुस्तकों की संख्या को दर्शाता है |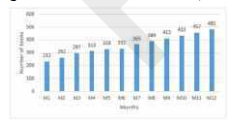 The number of books sold in month M3 is what percent of books sold in month M6?
माह M3 में बेची गयी पुस्तकों की संख्या माह M6 में बेची गयी पुस्तकों की संख्या का कितना प्रतिशत है ?
View SolutionThe bar graph given below presents the number of books sold by a bookseller during different months of a year.
नीचे दिया गया दंड आरेख एक पुस्तक विक्रेता के द्वारा किसी वर्ष के अलग-अलग महीनों में बेची गयी पुस्तकों की संख्या को दर्शाता है |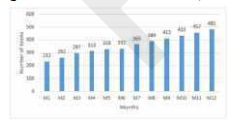 What is the total number of books sold by the bookseller in the year?
वर्ष में इस पुस्तक विक्रेता के द्वारा बेची गयी पुस्तकों की संख्या कुल कितनी है ?
View SolutionThe given table represents the sale (in thousands) of cars by four companies A,B,C and D in six years. Study the table and answer the questions that follow: दी गयी तालिका चार कंपनियों - A, B, C और D के द्वारा छः वर्षों में की गयी कारों की बिक्री ( हज़ार में ) दर्शाती है | इस तालिका का अध्ययन करें तथा फिर पूछे गए प्रश्नों के उत्तर दें | What is the ratio of total number of cars sold by companies A,B and D in 2017 to the total number of cars sold by all companies in 2018? कंपनी A, B और D के द्वारा 2017 में बेची गयी कारों की कुल संख्या तथा 2018 में सभी कंपनियों के द्वारा बेची गयी कारों की कुल संख्या के बीच क्या अनुपात है ?
View SolutionIn the following table, the production of various crops (in tonnes) is given from 2015 to 2019. Study the table and answer the question that follows:
दी गयी तालिका में, 2015 से 2019 तक विभिन्न फसलों का उत्पादन (टन में ) दिया गया है | इस तालिका का अध्ययन करें तथा फिर पूछे गए प्रश्न का उत्तर दीजिए |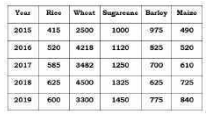 The percentage growth of maize in the year 2019 over the year 2015 is: (correct to one decimal place)
वर्ष 2019 में वर्ष 2015 की तुलना में मक्का के उत्पादन में कितने प्रतिशत की वृद्धि हुई है ? ( दशमलव के एक स्थान तक )
View SolutionStudy the chart and answer the questions:
In which of the given years is the percentage increase in the number of hotels in comparison to the previous year, is the maximum?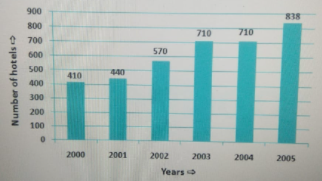
चार्ट का अध्ययन करें और प्रश्नों का उत्तर दें:पिछले वर्ष की तुलना में होटलों की संख्या में किस वर्ष में अधिकतम प्रतिशत वृद्धि हुई है?
View Solution
