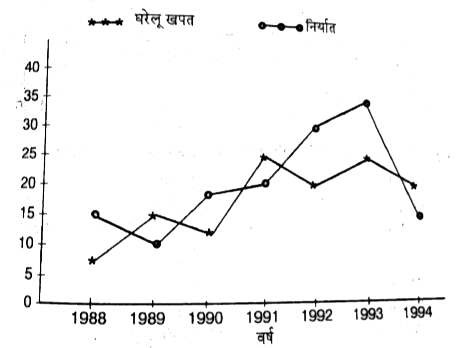
विभिन्न वर्षों में घरेलू खपत तथा निर्यात मात्रा (हजार टन में)

किस वर्ष पिछले वर्ष की तुलना में निर्यात में प्रतिशत उतार-चढ़ाव अधिकतम था ?
1989
1991
1994
1990
The correct Answer is:D
Step by step video, text & image solution for विभिन्न वर्षों में घरेलू खपत तथा निर्यात मात्रा (हजार टन में) किस वर्ष पिछले वर्ष की तुलना में निर्यात में प्रतिशत उतार-चढ़ाव अधिकतम था ? by Maths experts to help you in doubts & scoring excellent marks in Class 14 exams.
Updated on:21/07/2023Topper's Solved these Questions
- ग्राफBook:MAHESH MISHRAChapter:ग्राफExercise:29 C प्रतियोगी परीक्षाओं हेतु अभ्यास प्रश्नमाला
Explore 71 Videos
- ग्राफBook:MAHESH MISHRAChapter:ग्राफExercise:29 C प्रतियोगी परीक्षाओं हेतु अभ्यास प्रश्नमाला
Explore 71 Videos
- क्रमचय और संचयBook:MAHESH MISHRAChapter:क्रमचय और संचयExercise:26 C (प्रतियोगी परीक्षाओं हेतु अभ्यास प्रश्नमाला)
Explore 35 Videos
- घातांक एंव करणीBook:MAHESH MISHRAChapter:घातांक एंव करणीExercise:4 C (प्रतियोगी परीक्षाओं हेतु अभ्यास प्रश्नमाला)
Explore 90 Videos
Similar Questions
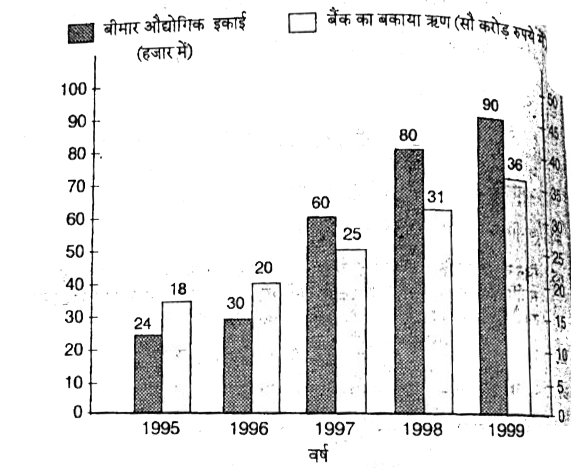
विभिन्न वर्षों में बीमार औद्योगिक इकाईयों की संख्या (×1000) तथा बैंक का बकाया ऋण (×100) करोड़ रुपये में

किस वर्ष बैंक का ऋण प्रति बीमार इकाई अधिकतम था ?
View Solutionविभिन्न वर्षों में बीमार औद्योगिक इकाईयों की संख्या (×1000) तथा बैंक का बकाया ऋण (×100) करोड़ रुपये में

किस वर्ष बैंक का ऋण प्रति बीमार इकाई अधिकतम था ?
View Solution8 छात्र गणित विषय के, 7 छात्र विज्ञान के तथा 4 छात्र अंग्रेजी विषय के है। कितने तरीके से इन छात्रों को स्कॉलरशिप दिए जा सकते हैं यदि यह सर्वोच्च स्थान प्राप्त करनेवालों को ही दिया जाता है ?
View Solution81√0.04=?
View SolutionHow many lines of symmetry does the above figure have ?
View SolutionWhich of the following are correct chain isomers of butane ? (i)
View SolutionDetermine the point of symmetry of a regular hexagon.
View SolutionDtermine the images of the following figure about the given line :
View SolutionMatch the following Column A to Column B

View SolutionMatch the following Column A to Column B

View SolutionMatch the following Column A to Column B

View SolutionThe inequation represented by the graph given below is :
View SolutionThe inequation that best describes the graph given below is _________
View SolutionThe inequation that best describes the following graph is _________
View SolutionWhich inequations represent the shaded region in the given figure
View SolutionThe given Bar Graph presents the number of students of two schools for six years. दिया गया दंड आरेख छः वर्ष की अवधि में दो विद्यालयों में छात्रों की संख्या को दर्शाता है | In which year, the percentage increase in students in school B is the highest in comparison to its previous year? किस वर्ष में, विद्यालय B में छात्रों की संख्या में प्रतिशत वृद्धि इसके पिछले वर्ष की तुलना में सबसे अधिक रही है?
View Solution
