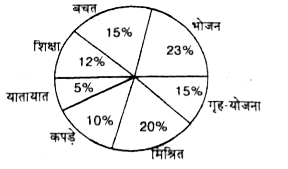
निम्नांकित वृत्त चार्ट किसी परिवार द्वारा विभिन्न मदों किए गए वार्षिक सर्व कि खर्च तथा उसकी बचत के प्रतिशत को दिखाता है।

यदि परिवार की कुल वार्षिक आय 100000 रु.थी तब शिक्षा और गृह योजना पर किये गए खर्चों में कितने रुपये का अन्तर था ?
1500 रु.
8000 रु.
4000 रु.
3000 रु.
The correct Answer is:D
Step by step video, text & image solution for निम्नांकित वृत्त चार्ट किसी परिवार द्वारा विभिन्न मदों किए गए वार्षिक सर्व कि खर्च तथा उसकी बचत के प्रतिशत को दिखाता है। यदि परिवार की कुल वार्षिक आय 100000 रु.थी तब शिक्षा और गृह योजना पर किये गए खर्चों में कितने रुपये का अन्तर था ? by Maths experts to help you in doubts & scoring excellent marks in Class 14 exams.
Updated on:21/07/2023Topper's Solved these Questions
- ग्राफBook:MAHESH MISHRAChapter:ग्राफExercise:29 C प्रतियोगी परीक्षाओं हेतु अभ्यास प्रश्नमाला
Explore 71 Videos
- ग्राफBook:MAHESH MISHRAChapter:ग्राफExercise:29 C प्रतियोगी परीक्षाओं हेतु अभ्यास प्रश्नमाला
Explore 71 Videos
- क्रमचय और संचयBook:MAHESH MISHRAChapter:क्रमचय और संचयExercise:26 C (प्रतियोगी परीक्षाओं हेतु अभ्यास प्रश्नमाला)
Explore 35 Videos
- घातांक एंव करणीBook:MAHESH MISHRAChapter:घातांक एंव करणीExercise:4 C (प्रतियोगी परीक्षाओं हेतु अभ्यास प्रश्नमाला)
Explore 90 Videos
Similar Questions
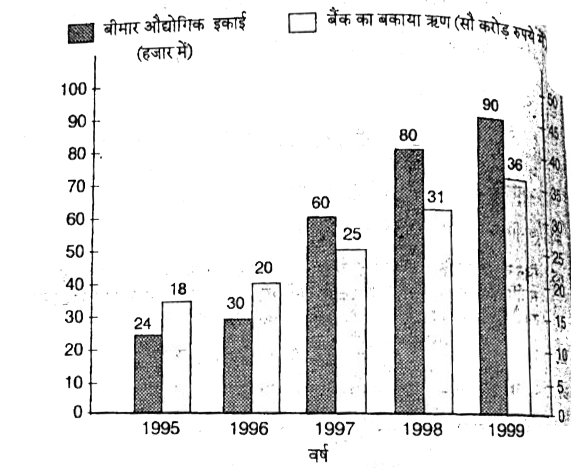
विभिन्न वर्षों में बीमार औद्योगिक इकाईयों की संख्या (×1000) तथा बैंक का बकाया ऋण (×100) करोड़ रुपये में

किस वर्ष बैंक का ऋण प्रति बीमार इकाई अधिकतम था ?
View Solutionविभिन्न वर्षों में बीमार औद्योगिक इकाईयों की संख्या (×1000) तथा बैंक का बकाया ऋण (×100) करोड़ रुपये में

किस वर्ष बैंक का ऋण प्रति बीमार इकाई अधिकतम था ?
View Solution8 छात्र गणित विषय के, 7 छात्र विज्ञान के तथा 4 छात्र अंग्रेजी विषय के है। कितने तरीके से इन छात्रों को स्कॉलरशिप दिए जा सकते हैं यदि यह सर्वोच्च स्थान प्राप्त करनेवालों को ही दिया जाता है ?
View Solution81√0.04=?
View SolutionDetermine the point of symmetry of a regular hexagon.
View SolutionMatch the following Column A to Column B

View SolutionMatch the following Column A to Column B

View SolutionMatch the following Column A to Column B

View SolutionThe inequation represented by the graph given below is :
View SolutionThe inequation that best describes the graph given below is _________
View SolutionThe inequation that best describes the following graph is _________
View SolutionThe following pie-chart shows the monthly expenditure of a family on various items. If the family spends Rs. 825 on clothing, answer the question. निम्नलिखित पाई-चार्ट में किसी परिवार के विभिन्न मदों पर होने वाले खर्च का दर्शाया गया है। यदि परिवार वस्त्रों पर 825 रू खर्च करे तो प्रश्न का उत्तर दीजिए। What is the total monthly income of the family? परिवार की कुल मासिक आय कितनी है?
View SolutionThe following pie-chart shows the monthly expenditure of a family on various items. If the family spends Rs. 825 on clothing, answer the question. निम्नलिखित पाई-चार्ट में किसी परिवार के विभिन्न मदों पर होने वाले खर्च का दर्शाया गया है। यदि परिवार वस्त्रों पर 825 रू खर्च करे तो प्रश्न का उत्तर दीजिए। What percent of the total income does the family save? परिवार में कुल आय को कितनी प्रतिशत राशि की बचत की जाती है?
View SolutionThe following pe chart shows the monthly expenditure of a family on various items. If the family spends Rs. 825 on clothing, answer the question. निम्नलिखित पाई-चार्ट में किसी परिवार के विभिन्न मदों पर होने वाले खर्च का दर्शाया गया है। यदि परिवार वस्त्रों पर 825 रू खर्च करे तो प्रश्न का उत्तर दीजिए। What is the average of expenses on clothing and rent? वस्त्रों और किराये पर खर्च होने वाली औसत राशि बताएं ?
View SolutionThe following pie-chart shows the monthly expenditure of a family on various items. If the family spends Rs. 825 on clothing, answer the question. निम्नलिखित पाई-चार्ट में किसी परिवार के विभिन्न मदों पर होने वाले खर्च का दर्शाया गया है। यदि परिवार वस्त्रों पर 825 रू खर्च करे तो प्रश्न का उत्तर दीजिए। The ratio of average of expenses on food, clothing and miscellaneous items to the average of expenses on savings and rent is भोजन, वस्त्र ओर विविध मदों पर होने वाले खर्च के औसत का बचत और किराये पर होने वाले खर्च के औसत से अनुपात क्या है?
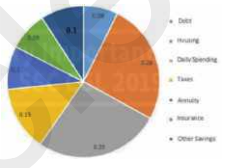
View SolutionThe Pie chart given below presents the figures of different heads of expenditure made in a year by Anurag. If his total annual income is Rs1,20,000, then how much did he spend on Housing?
नीचे दिया गया वृत्त आरेख एक वर्ष में अनुराग के द्वारा किये गए विभिन्न प्रकार के व्ययों को दर्शाता है | यदि उसकी कुल वार्षिक आय 1,20,000 है, तो उसने आवास पर कितना खर्च किया ?
View Solution