जनवरी-मार्च 2018 के दौरान A के द्वारा प्रति माह औसत बिक्री क्या है ?
7333.33kg/किग्रा
7505/किग्रा
7334.67/किग्रा
5500/किग्रा
The correct Answer is:A
Step by step video, text & image solution for जनवरी-मार्च 2018 के दौरान A के द्वारा प्रति माह औसत बिक्री क्या है ? by Maths experts to help you in doubts & scoring excellent marks in Class 14 exams.
Updated on:21/07/2023Topper's Solved these Questions
Similar Questions
यदि A:B=2:3 और B:C=3:7, तो A+B:B+C:C+A क्या होगा?
View SolutionP और Q की वर्तमान आयु के बीच का क्रमशः अनुपात 3 : 4 है। चार वर्ष बाद Q, P से पाँच वर्ष बड़ा होगा।P की वर्तमान आयु कितनी है?
View Solutionनिम्नलिखित प्रश्नो के उत्तर दीजिए : रैदास जी ने प्रभु के प्रति अपना भक्तिभाव किन दृस्टांतो द्वारा स्पष्ट किया है ?
View Solutionबिस्मिल्ला खाँ को खुद के प्रति क्या विश्वास है ?
View Solutionमोहन के प्रति धनराम के मन में क्या भावना थी।
View Solutionमीरा के पद' किस के द्वारा संकलित-संपादित है?
View SolutionThe average weight of 8 gold coins is 20 g per coin. The average weight of 12 coins of silver is 35 g per coin. What is the average weight per coin for 20 coins?
8 सोने के सिक्कों का औसत भार 20g प्रति सिक्का है | चाँदी के 12 सिक्को का औसत भार 35 g प्रति सिक्का है | 2 सिक्को के लिए प्रति सिक्का औसत भार कितना है ?
View SolutionThe given bar chart shows the details of cycle sales by a company between January and May for years 2017 and 2018.
दिया गया दंड आरेख वर्ष 2017 एवं 2018 में एक कंपनी के द्वारा जनवरी से लेकर मई तक साइकिल बिक्री की जानकारी देता है |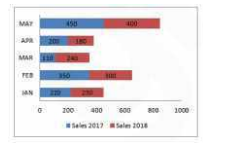 In the given bar-chart, which month sales show the maximum decrease in 2018 as compared to 2017?
दिए गए दंड आरेख में, किस माह की बिक्री 2017 की तुलना में 2018 में अधिकतम कमी को दर्शाती है ?
View SolutionThe given Bar Graph presents the sale (in 1000 kg) of a particular brand of tea by three outlets. A, B and C during the months feb, Mar and Apr,2018 दिया गया दंड आरेख तीन आउटलेट A, B और C के द्वारा तीन महीनों : फरवरी, मार्च और अप्रैल 2018 में एक विशेष ब्रांड की चाय की बिक्री ( हज़ार किलो ग्राम में ) को दर्शाता है | What is the ratio of rate of growth in sales from B to the rate of growth in sales from C in Mar 2018 with reference to its previous month? पिछले माह की तुलना में मार्च 2018 में B की बिक्री में वृद्धि का C की बिक्री में वृद्धि के साथ अनुपात ज्ञात करें |
View SolutionThe given Bar Graph presents the sale (in 1000 kg) of a particular brand of tea by three outlets. A, B and C during the months feb, Mar and Apr,2018 दिया गया दंड आरेख तीन आउटलेट A, B और C के द्वारा तीन महीनों : फरवरी, मार्च और अप्रैल 2018 में एक विशेष ब्रांड की चाय की बिक्री ( हज़ार किलो ग्राम में ) को दर्शाता है | What is the average sale per1 month by A during Jan-Mar, 2018? जनवरी से मार्च 2018 तक A की प्रतिमाह औसत बिक्री कितनी रही है ?
View SolutionThe given table represents the sale (in thousands) of cars by four companies A,B,C and D in six years. Study the table and answer the questions that follow: | .................................................................................................................................................................................The total number of cars sold by company C in 2018 exceeds the average number of cars sold by company A during 2014 to 2018 by: कंपनी C के द्वारा 2018 में बेची गयी कारों की कुल संख्या 2014 से 2018 के दौरान कंपनी A के द्वारा बेची गयी कारों की औसत संख्या से कितनी अधिक है ?
View SolutionThe given Bar Graph presents the sale (in 1000kg) of a particular brand of tea by three outlets, A, B and C during the months of Jan, Feb, Mar and Apr, 2018.
दिया गया दंड आरेख (बार ग्राफ) तीन विक्रय केंद्रों A, B और C के दवारा चाय के किसी खास ब्रांड की जनवरी , फरवरी ,मार्च और अप्रैल ,2018 के दौरान (1000 kg में ) बिक्री को दर्शाता है |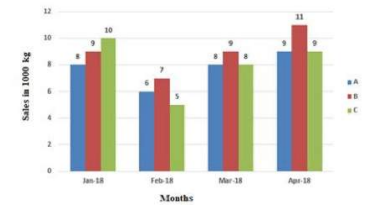 What is the ratio of the rate of growth in sales from B to the rate of growth in sales from C in Mar 2018 with reference to its previous month?
पिछले महीने की तुलना में ,मार्च 2018 में B की बिक्री वृद्धि-दर तथा C की बिक्री वृद्धि-दर का क्या अनुपात है ?
View SolutionThe given Bar Graph presents the sale (in 1000kg) of a particular brand of tea by three outlets, A, B and C during the months of Jan, Feb, Mar and Apr, 2018.
दिया गया दंड आरेख (बार ग्राफ) तीन विक्रय केंद्रों A, B और C के दवारा चाय के किसी खास ब्रांड की जनवरी , फरवरी ,मार्च और अप्रैल ,2018 के दौरान (1000 kg में ) बिक्री को दर्शाता है |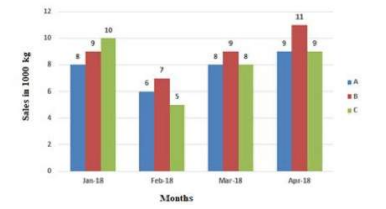 By how much quantity is the average sale per month from B more or less than that from C?
B की प्रति माह औसत बिक्री की मात्रा, C की तुलना में कितना अधिक अथवा कम है?
View SolutionThe given bar graph presents the sale of a particular brand of car by three showrooms, A, B and C( in multiples of 100) during the months of Jan, Feb, Mar and Apr, 2016
दिया गया दंड आरेख (बार ग्राफ) तीन शो-रूम- A, B और C के द्वारा जनवरी, फरवरी, मार्च और अप्रैल, 2016 के दौरान कार के एक खास ब्रांड की (100 के गुणक में) बिक्री को दर्शाता है|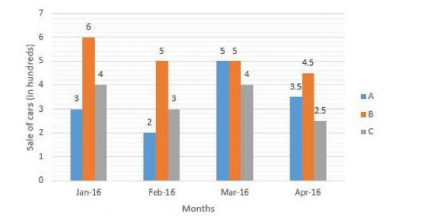 What is the ratio of the number of cars sold by A in Jan-Feb, 2016 to that of cars sold by B during Mar-Apr, 2016?
जनवरी-फरवरी, 2016 में A के द्वारा और मार्च-अप्रैल, 2016 के दौरान B के द्वारा बेची गई कारों की संख्या का अनुपात क्या है?
View SolutionThe given bar graph presents the sale of a particular brand of car by three showrooms, A, B and C( in multiples of 100) during the months of Jan, Feb, Mar and Apr, 2016
दिया गया दंड आरेख (बार ग्राफ) तीन शो-रूम- A, B और C के द्वारा जनवरी, फरवरी, मार्च और अप्रैल, 2016 के दौरान कार के एक खास ब्रांड की (100 के गुणक में) बिक्री को दर्शाता है|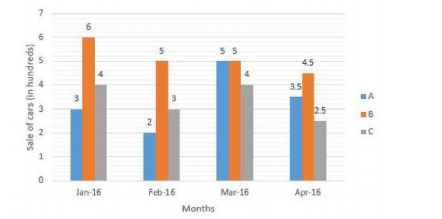 What was the average number of cars sold by A during Feb-Apr, 2016?
फरवरी-अप्रैल 2016 के दौरान, A के दवारा बेची गई कारों की औसत संख्या क्या थी?
View Solutionऐलुमिनियम द्वारा ऑक्साइड के अपचयन को क्या कहा जाता है?
View Solution
