वर्ष 2014-2015, 2015-2016 और 2016-2017 के दौरान कुल आयतो और निर्यातों का अनुपात कितना है ?
4175:4011
3664:4455
4455:3664
4011:4175
The correct Answer is:B
Step by step video, text & image solution for वर्ष 2014-2015, 2015-2016 और 2016-2017 के दौरान कुल आयतो और निर्यातों का अनुपात कितना है ? by Maths experts to help you in doubts & scoring excellent marks in Class 14 exams.
Updated on:21/07/2023Topper's Solved these Questions
Similar Questions
यदि A:B=2:3 और B:C=3:7, तो A+B:B+C:C+A क्या होगा?
View SolutionP और Q की वर्तमान आयु के बीच का क्रमशः अनुपात 3 : 4 है। चार वर्ष बाद Q, P से पाँच वर्ष बड़ा होगा।P की वर्तमान आयु कितनी है?
View SolutionThe remainder when the determinant
∣∣ ∣ ∣∣201420142015201520162016201720172018201820192019202020202021202120222022∣∣ ∣ ∣∣
is divided by 5 is-
View Solutionदिए गए सारणिक ∣∣ ∣ ∣∣201420142015201520162016201720172018201820192019202020202021202120222022∣∣ ∣ ∣∣ का विभाजन संख्या 5 से करने पर शेषफल का मान होगा
View Solutionदिए गए सारणिक ∣∣ ∣ ∣∣201420142015201520162016201720172018201820192019202020202021202120222022∣∣ ∣ ∣∣ का विभाजन संख्या 5 से करने पर शेषफल का मान होगा
View SolutionThe bar graph shows the exports of Cars of Type A and B (in Rs. million).
दिए गए दंड आरेख में टाइप A और B कारो के निर्यात को दर्शाया गया है (मिलियन रु. में)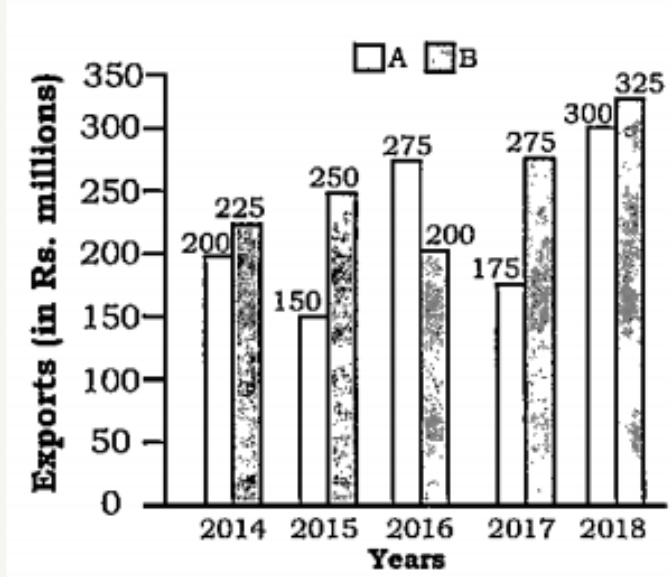 What is the ratio of the exports of cars of Type A in 2014 and 2018 to the total exports of cars of type B in 2015 and 2016?
2014 और 2018 में टाइप A कारो के कुल निर्यात और 2015 और 2016 में टाइप B कारो के कुल निर्यात का अनुपात क्या हे?
View SolutionSalary of A increased by 8% in the year 2015 as compared to 2014 and decreased by 6% in the year 2016 as compared to 2015. If his salary was Rs.2,34,778 in 2016, his salary (round off to nearest whole number) in 2014 was :
A के वेतन में वर्ष 2014 के मुकाबले वर्ष 2015 में 8% की वृद्धि हुई और 2015 के मुकाबले वर्ष 2016 में 6% की कमी हुई | यदि वर्ष 2016 में उसका वेतन रु 2, 34, 778 था तो 2014 में उसका वेतन (निकटतम संपूर्ण संख्या में पूर्णाकित) कितना था?
View SolutionThe table shows the production of different types of cars (in thousands).
 The total production of type D cars during 2015 to 2017 is what percent less than the total production of type E cars during 2014,2015,2016 and 2018 taken together?
2015 से 2017 के दौरान D प्रकार की कारों का कुल उत्पादन 2014, 2015, 2016 और 2018 में E प्रकार की कारों के कुल उत्पादन से कितना प्रतिशत कम है ?
View SolutionThe given Bar Graph presents Income and Expenditure (in crores of Rupees) of a company for the five years, 2014 to 2018. दिया गया दंड आरेख पांच वर्षों अर्थात 2014 से 2018 तक एक कंपनी के आय एवं व्यय ( करोड़ रुपये में ) को दर्शाता है | What is the ratio of total Expenditure to total Income of the company in 2014, 2016 and 2017? 2014, 2016 और 2017 में कंपनी के कुल व्यय और कुल आय में क्या अनुपात है ?
View SolutionThe given Bar Graph presents the Imports and Exports of an item (in tonnes) manufactured by a company for the five financial years, 2013-2014 to 2017-2018. दिया गया दंड आरेख पांच वित्तीय वर्षो अर्थत 2013-2014 से 2017-2018 तक एक कंपनी के द्वारा निर्मित किसी वस्तु के आयात और निर्यात ( टन में ) को दर्शाता है | What is the ratio of total Imports to total Exports during 2014-2015,2015-2016 and 2016-2017? 2014-2015, 2015-2016 और 2016-2017 के दौरान कुल आयात तथा कुल निर्यात के बीच अनुपात ज्ञात करें |
View SolutionThe given Bar Graph presents the Export of Tea and Coffee (in million kg) for the years 2012 to 2016. What is the ratio of total export of tea in 2012, 2014 and 2015 to the total export of coffee in 2013 and 2014?
दिया गया दंड आरेख वर्ष 2012 से 2016 के दौरान चाय और कॉफ़ी के निर्यात ( मिलियन किलो ग्राम में ) को दर्शाता है |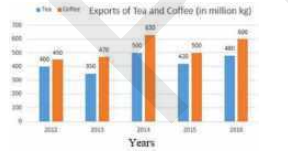
2012, 2014 और 2015 में चाय के कुल निर्यात का 2013 और 2014 में कॉफ़ी के कुल निर्यात के साथ अनुपात ज्ञात करें |
View SolutionThe table given below shows the number of units of a product produced and sold by a company in 6 years.
निम्न तालिका एक कंपनी द्वारा छह वर्षों के दौरान उत्पादित और बेचे गए उत्पाद की यूनिटों की संख्या दर्शाती है|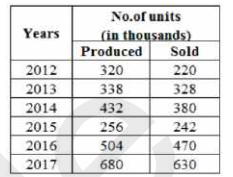 Find the ratio of the total number of units sold in 2013 and 2015 to the number of units produced in
2015 and 2016?
2013 और 2015 में बेची गई उत्पाद के यूनिटों की कुल संख्या तथा 2015 और 2016 में उत्पादित यूनिटों की संख्या का अनुपात ज्ञात कीजिए ?
View SolutionThe bar graph given below shows the target and actual production of cement ( in thousand tons ) during 2013-2017. The ratio of the target production in 2014 and 2016 to the actual total production in 2013, 2016 and 2017 is :
नीचे दिया गया दंड आरेख 2013-2017 के दौरान सीमेंट के लक्षित और वास्तविक उत्पादन (हजार टन में) को दर्शाता है |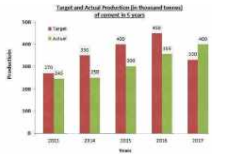
वर्ष 2014 और 2016 में सीमेंट के कुल लक्षित उत्पादन और 2013, 2016 तथा 2017 में कुल वास्तविक उत्पादन का अनुपात है :
View SolutionThe bar graph given below shows the target and actual production of cement ( in thousand tons ) during 2013-2017. What percentage of the total targeted production of cement from 2013 to 2017 is the total actual production in 2014, 2015 and 2017? ( correct to one decimal place )
नीचे दिया गया दंड आरेख 2013-2017 के दौरान सीमेंट के लक्षित और वास्तविक उत्पादन (हजार टन में) को दर्शाता है |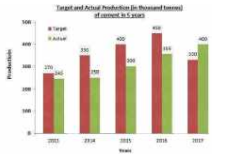
2013 से 2017 तक सीमेंट के कुल लक्षित उत्पादन का कितना प्रतिशत, 2014, 2015 और 2017 में कुल वास्तविक उत्पादन है ? (दशमलव के एक स्थान तक)
View SolutionStudy the given graph and answer the questions that follow.
दिए गए आरेख का अध्ययन करें और उन सवालों के जवाब दें, जो अनुसरण करते हैं।
The total revenue in 2015 and 2017 is what percent of the total expenditure of the company in 2016, 2018 and 2019 (correct to one decimal place) ?
2015 और 2017 में कुल राजस्व 2016, 2018 और 2019 में कंपनी के कुल व्यय का कितना प्रतिशत है (एक दशमलव स्थान तक )?
View SolutionThe given Bar Graph presents Income and Expenditure (in crores of Rupees) of a company for five years, 2014 to 2018. What is the ratio of total Expenditure to total Income of the company in 2014,2016 and 2017? दिया गया दंड आरेख (बार ग्राफ) 5 वर्षों, 2014 से 2018 के दौरान किसी कंपनी की आय और व्यय (करोड़ रुपए में) को दर्शाता है| 2014, 2016 और 2017 में कंपनी के कुल व्यय और कुल आय का अनुपात क्या है?
View Solution
