What is the ratio of the total exports of cars of type A in 2014 and 2018 to the total exports of cars of type B in 2015 and 2016
11:10
10:9
5:4
3:2
The correct Answer is:B
To solve the question, we need to find the ratio of the total exports of cars of type A in 2014 and 2018 to the total exports of cars of type B in 2015 and 2016. Here’s how we can do that step by step:
Step 1: Find the total exports of cars of type A in 2014 and 2018.
- According to the data, the exports of cars of type A are:
- In 2014: 200 cars
- In 2018: 300 cars
- Now, we add these two values together:
Total exports of type A=200+300=500
Step 2: Find the total exports of cars of type B in 2015 and 2016.
- According to the data, the exports of cars of type B are:
- In 2015: 250 cars
- In 2016: 200 cars
- Now, we add these two values together:
Total exports of type B=250+200=450
Step 3: Calculate the ratio of the total exports of type A to type B.
- We now have:
- Total exports of type A (2014 and 2018) = 500
- Total exports of type B (2015 and 2016) = 450
- The ratio can be expressed as:
Ratio=Total exports of type ATotal exports of type B=500450
Step 4: Simplify the ratio.
- To simplify the ratio 500450, we can divide both the numerator and the denominator by 50:
500÷50450÷50=109
Final Answer:
The ratio of the total exports of cars of type A in 2014 and 2018 to the total exports of cars of type B in 2015 and 2016 is 10:9.
---
- According to the data, the exports of cars of type A are:
- In 2014: 200 cars
- In 2018: 300 cars
- Now, we add these two values together:
Total exports of type A=200+300=500
- According to the data, the exports of cars of type B are:
- In 2015: 250 cars
- In 2016: 200 cars
- Now, we add these two values together:
Total exports of type B=250+200=450
- We now have:
- Total exports of type A (2014 and 2018) = 500
- Total exports of type B (2015 and 2016) = 450
- The ratio can be expressed as:
Ratio=Total exports of type ATotal exports of type B=500450
- To simplify the ratio 500450, we can divide both the numerator and the denominator by 50:
500÷50450÷50=109
The ratio of the total exports of cars of type A in 2014 and 2018 to the total exports of cars of type B in 2015 and 2016 is 10:9.
Topper's Solved these Questions
Similar Questions
The bar graph shows the exports of Cars of Type A and B (in Rs. million).
दिए गए दंड आरेख में टाइप A और B कारो के निर्यात को दर्शाया गया है (मिलियन रु. में)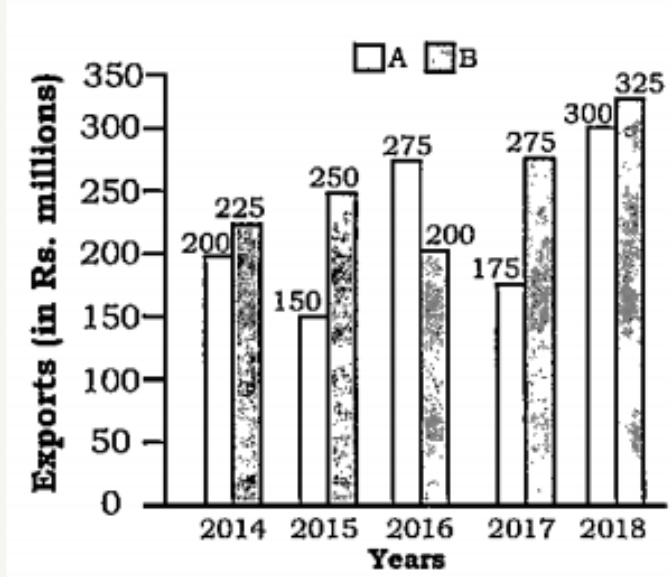 What is the ratio of the exports of cars of Type A in 2014 and 2018 to the total exports of cars of type B in 2015 and 2016?
2014 और 2018 में टाइप A कारो के कुल निर्यात और 2015 और 2016 में टाइप B कारो के कुल निर्यात का अनुपात क्या हे?
View SolutionThe given Bar Graph presents the Export of Tea and Coffee (in million kg) for the years 2012 to 2016. What is the ratio of total export of tea in 2012, 2014 and 2015 to the total export of coffee in 2013 and 2014?
दिया गया दंड आरेख वर्ष 2012 से 2016 के दौरान चाय और कॉफ़ी के निर्यात ( मिलियन किलो ग्राम में ) को दर्शाता है |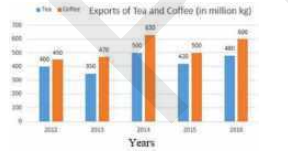
2012, 2014 और 2015 में चाय के कुल निर्यात का 2013 और 2014 में कॉफ़ी के कुल निर्यात के साथ अनुपात ज्ञात करें |
View Solution
Knowledge Check
The given Bar Graph presents a country's exports (in million rupees) during 2015-2018, and the Table the follows shows the break-up of goods exported in a year.
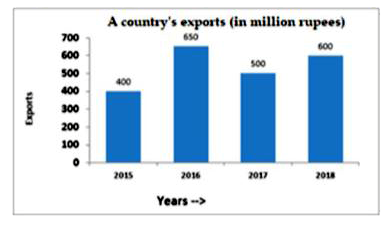
Break-Up of Goods Exported in a Year
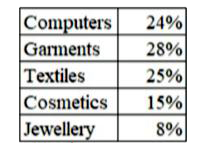
What is the ratio of the total exports of computers in 2015 and 2017 to the total exports of cosmetics in 2015 and 2018 ?A27:20B36:25C3:2D8:5The given table represents the exports (in ₹ crores) of four items A,B, C and D over a period of six years. Study the table carefully and answer the questions that follows:
दी गयी तालिका छः वर्षों की अवधि के दौरान चार वस्तुओं A, B, C और D के निर्यात ( करोड़ रुपये में ) को दर्शाती है | इस तालिका का अध्ययन करें तथा फिर पूछे गए प्रश्नों के उत्तर दें |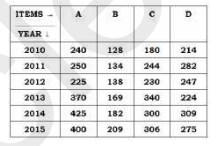 What is the ratio of the total exports of item A in 2014 and 2015 to the total exports of item C in 2011 and 2015?
2014 में वस्तु A के निर्यात का 2011 तथा 2015 में वस्तु C के कुल निर्यात के साथ अनुपात ज्ञात कीजिए |A3:2B4:3C7:5D5:4The given Bar graph presents the Export of Tea and Coffe ( in million kg ) for the years 2012 to 2016.
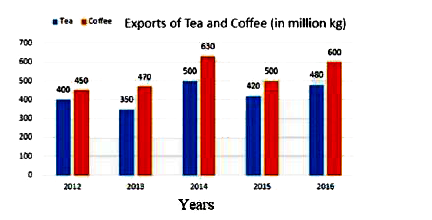
What is thr ratio of total export of tea in 2012 , 2014 and 2015 to the total export of coffee in 2013 and 2014 ?A6:5B10:9C9:10D5:6
The table shows the production of different types of cars (in thousands).
यह तालिका अलग-अलग प्रकार के कारों का उत्पादन ( हज़ार में) दर्शाती है |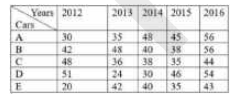 What is the ratio of the total production of cars of type A in 2014 and type C in 2013 taken together to the total production of cars of type B in 2016 and type E in 2015 taken together?
2014 में A प्रकार की कारों और 2013 में C प्रकार की कारों के कु ल उत्पादन का 2016 में B प्रकार की कारों और 2015 में E प्रकार की कारों के कुल उत्पादन के साथ अनुपात ज्ञात करें |
View SolutionThe table shows the production of different types of cars (in thousands). Study the table carefully and answer the questions

What is the ratio of the total production of cars ot type A in 2014 and type C in 2013 taken together to the total production of cars of type B in 2016 and type E in 2015 taken together?
View SolutionThe table shows the production of different types of cars (in thousands).
यह तालिका एक कंपनी द्वारा अलग-अलग कारों के उत्पादन ( हज़ार में ) को दर्शाती है |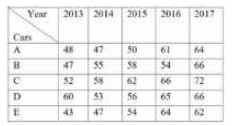 The ratio of the total production of type A cars in 2017 and type D cars in 2015 to the total production of type B and type E cars in 2013 is:
2017 में A प्रकार तथा 2015 में प्रकार की कारों के कुल उत्पादन का 2013 में B और E प्रकार की कारों के कुल उत्पादन के साथ अनुपात ज्ञात करें |
View SolutionThe table shows the production of different types of cars ( in thousands).
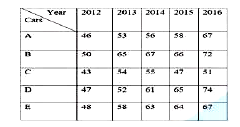
What is the ratio of the total production of type C and D cars in 2012 to the total production of type A cars in 2014 and type E cars in 2015?
View SolutionThe table shows the production of different types of cars (in thousands)
यह तालिका अलग-अलग प्रकार के कारों का उत्पादन ( हज़ार में ) दर्शाती है |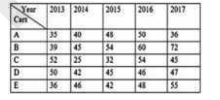 The ratio of the total production of cars of type C and E taken together in 2013 to the total production of cars of type D in 2014 and 2016 and type E in 2017 taken together is:
2013 में C और E प्रकार की कारों के कुल उत्पादन का 2014 और 2016 में D तथा 2017 में E प्रकार की कारों के कुल उत्पादन के साथ अनुपात ज्ञात करें |
View Solution