In which academic year the difference between the number of students passed and that of those failed is the lowest?
2013-2014
2014-2015
2016-2017
2015-2016
The correct Answer is:A
To solve the question, we need to analyze the data provided in the bar graph for the academic years from 2013-14 to 2017-18. We will calculate the difference between the number of students who passed and those who failed for each academic year and then identify the year with the lowest difference.
1. Identify the Academic Years: The academic years in question are 2013-14, 2014-15, 2015-16, 2016-17, and 2017-18.
2. Extract Data from the Bar Graph:
- For each academic year, note the number of students who passed and the number who failed. (Assuming hypothetical values as the actual bar graph data is not provided in the question).
- Let's say:
- 2013-14: Passed = 200, Failed = 150
- 2014-15: Passed = 300, Failed = 200
- 2015-16: Passed = 100, Failed = 350
- 2016-17: Passed = 250, Failed = 100
- 2017-18: Passed = 400, Failed = 300
3. Calculate Differences:
- For 2013-14: Difference = 200 - 150 = 50
- For 2014-15: Difference = 300 - 200 = 100
- For 2015-16: Difference = 100 - 350 = 250
- For 2016-17: Difference = 250 - 100 = 150
- For 2017-18: Difference = 400 - 300 = 100
4. List the Differences:
- 2013-14: 50
- 2014-15: 100
- 2015-16: 250
- 2016-17: 150
- 2017-18: 100
5. Identify the Lowest Difference:
- From the calculated differences, the lowest difference is 50, which occurs in the academic year 2013-14.
6. Conclusion:
- The academic year with the lowest difference between the number of students passed and failed is 2013-14.
Final Answer:
The academic year in which the difference between the number of students passed and that of those failed is the lowest is 2013-14.
- For each academic year, note the number of students who passed and the number who failed. (Assuming hypothetical values as the actual bar graph data is not provided in the question).
- Let's say:
- 2013-14: Passed = 200, Failed = 150
- 2014-15: Passed = 300, Failed = 200
- 2015-16: Passed = 100, Failed = 350
- 2016-17: Passed = 250, Failed = 100
- 2017-18: Passed = 400, Failed = 300
- For 2013-14: Difference = 200 - 150 = 50
- For 2014-15: Difference = 300 - 200 = 100
- For 2015-16: Difference = 100 - 350 = 250
- For 2016-17: Difference = 250 - 100 = 150
- For 2017-18: Difference = 400 - 300 = 100
- 2013-14: 50
- 2014-15: 100
- 2015-16: 250
- 2016-17: 150
- 2017-18: 100
- From the calculated differences, the lowest difference is 50, which occurs in the academic year 2013-14.
- The academic year with the lowest difference between the number of students passed and failed is 2013-14.
The academic year in which the difference between the number of students passed and that of those failed is the lowest is 2013-14.
Topper's Solved these Questions
Similar Questions
The given Bar Graph presents the results in terms of the number of students in a school for the five academic years, 2013-2014 to 2017-2018.
दिया गया दंड आरेख (बार ग्राफ) पाँच शैक्षणिक वर्षों , 2013-2014 से 2017-2018 तक, के दौरान एक स्कूल के परीक्षाफल के संदर्भ में विधाथ्थियों की संख्या को दर्शाता है।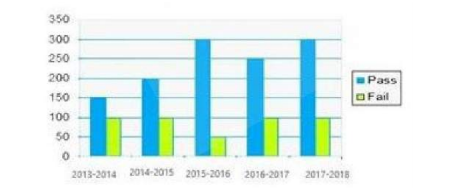
In which academic year the difference between the number of students passed and and that of those failed is the lowest?
किस शैक्षणिक वर्ष में उत्तीर्ण और अनुत्तीर्ण विद्यार्थियों की संख्या के बीच का अंतर सबसे कम है?
View SolutionThe given Bar Graph presents the results in terms of number of students for the five academic years, 2013-2014 to 2017-2018.
दिया गया दंड आरेख पांच शैक्षणिक वर्षों : 2013-2014 से 2017-2018 तक छात्रों की संख्या के संदर्भ में परिणामों को प्रस्तुत करता है | The difference between the number of students passed and those who failed is the highest in
which academic year?
किस शैक्षणिक वर्ष में पास करने वाले तथा फेल करने वाले छात्रों की संख्या में सर्वाधिक अंतर है ?
View Solution
Knowledge Check
The difference between the number of students passed and those who failed is the highest in which academic year
A2015-2016B2014-2015C2017-2018D2016-2017The given bar graph presents the number of students two schools for six years.
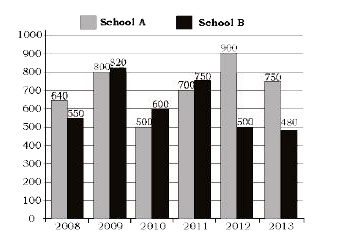
In which year, the absolute difference between the number of students in two schools is the highest?A2013B2010C2012D2011Study the following multiple bar graph carefully and answer the questions.
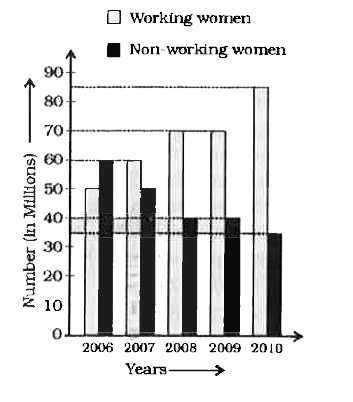
In which year or years, the difference between the number of working and non-working women the lowest ?A2006 and 2007B2007 and 2008COnly 2006DOnly 2007
The given bar graph presents the results in terms of number of students in a school for the 5 academic years, 2013-2014 to 2017-2018.
दिया गया दंड आरेख ( बार ग्राफ) 5 शैक्षणिक वर्षो, 2013-2014 से 2017-2018, के दौरान किसी स्कूल के परीक्षाफल को विद्यार्थियों की संख्या के रूप में दर्शाता है|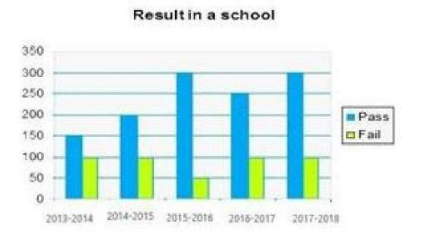
The difference between the number of students passed and those who failed is the highest in which academic year?
उत्तीर्ण छात्रों की संख्या और अनुन्तीर्ण होने वालों के बीच का अंतर किस शैक्षणिक वर्ष में सबसे अधिक है?
View Solution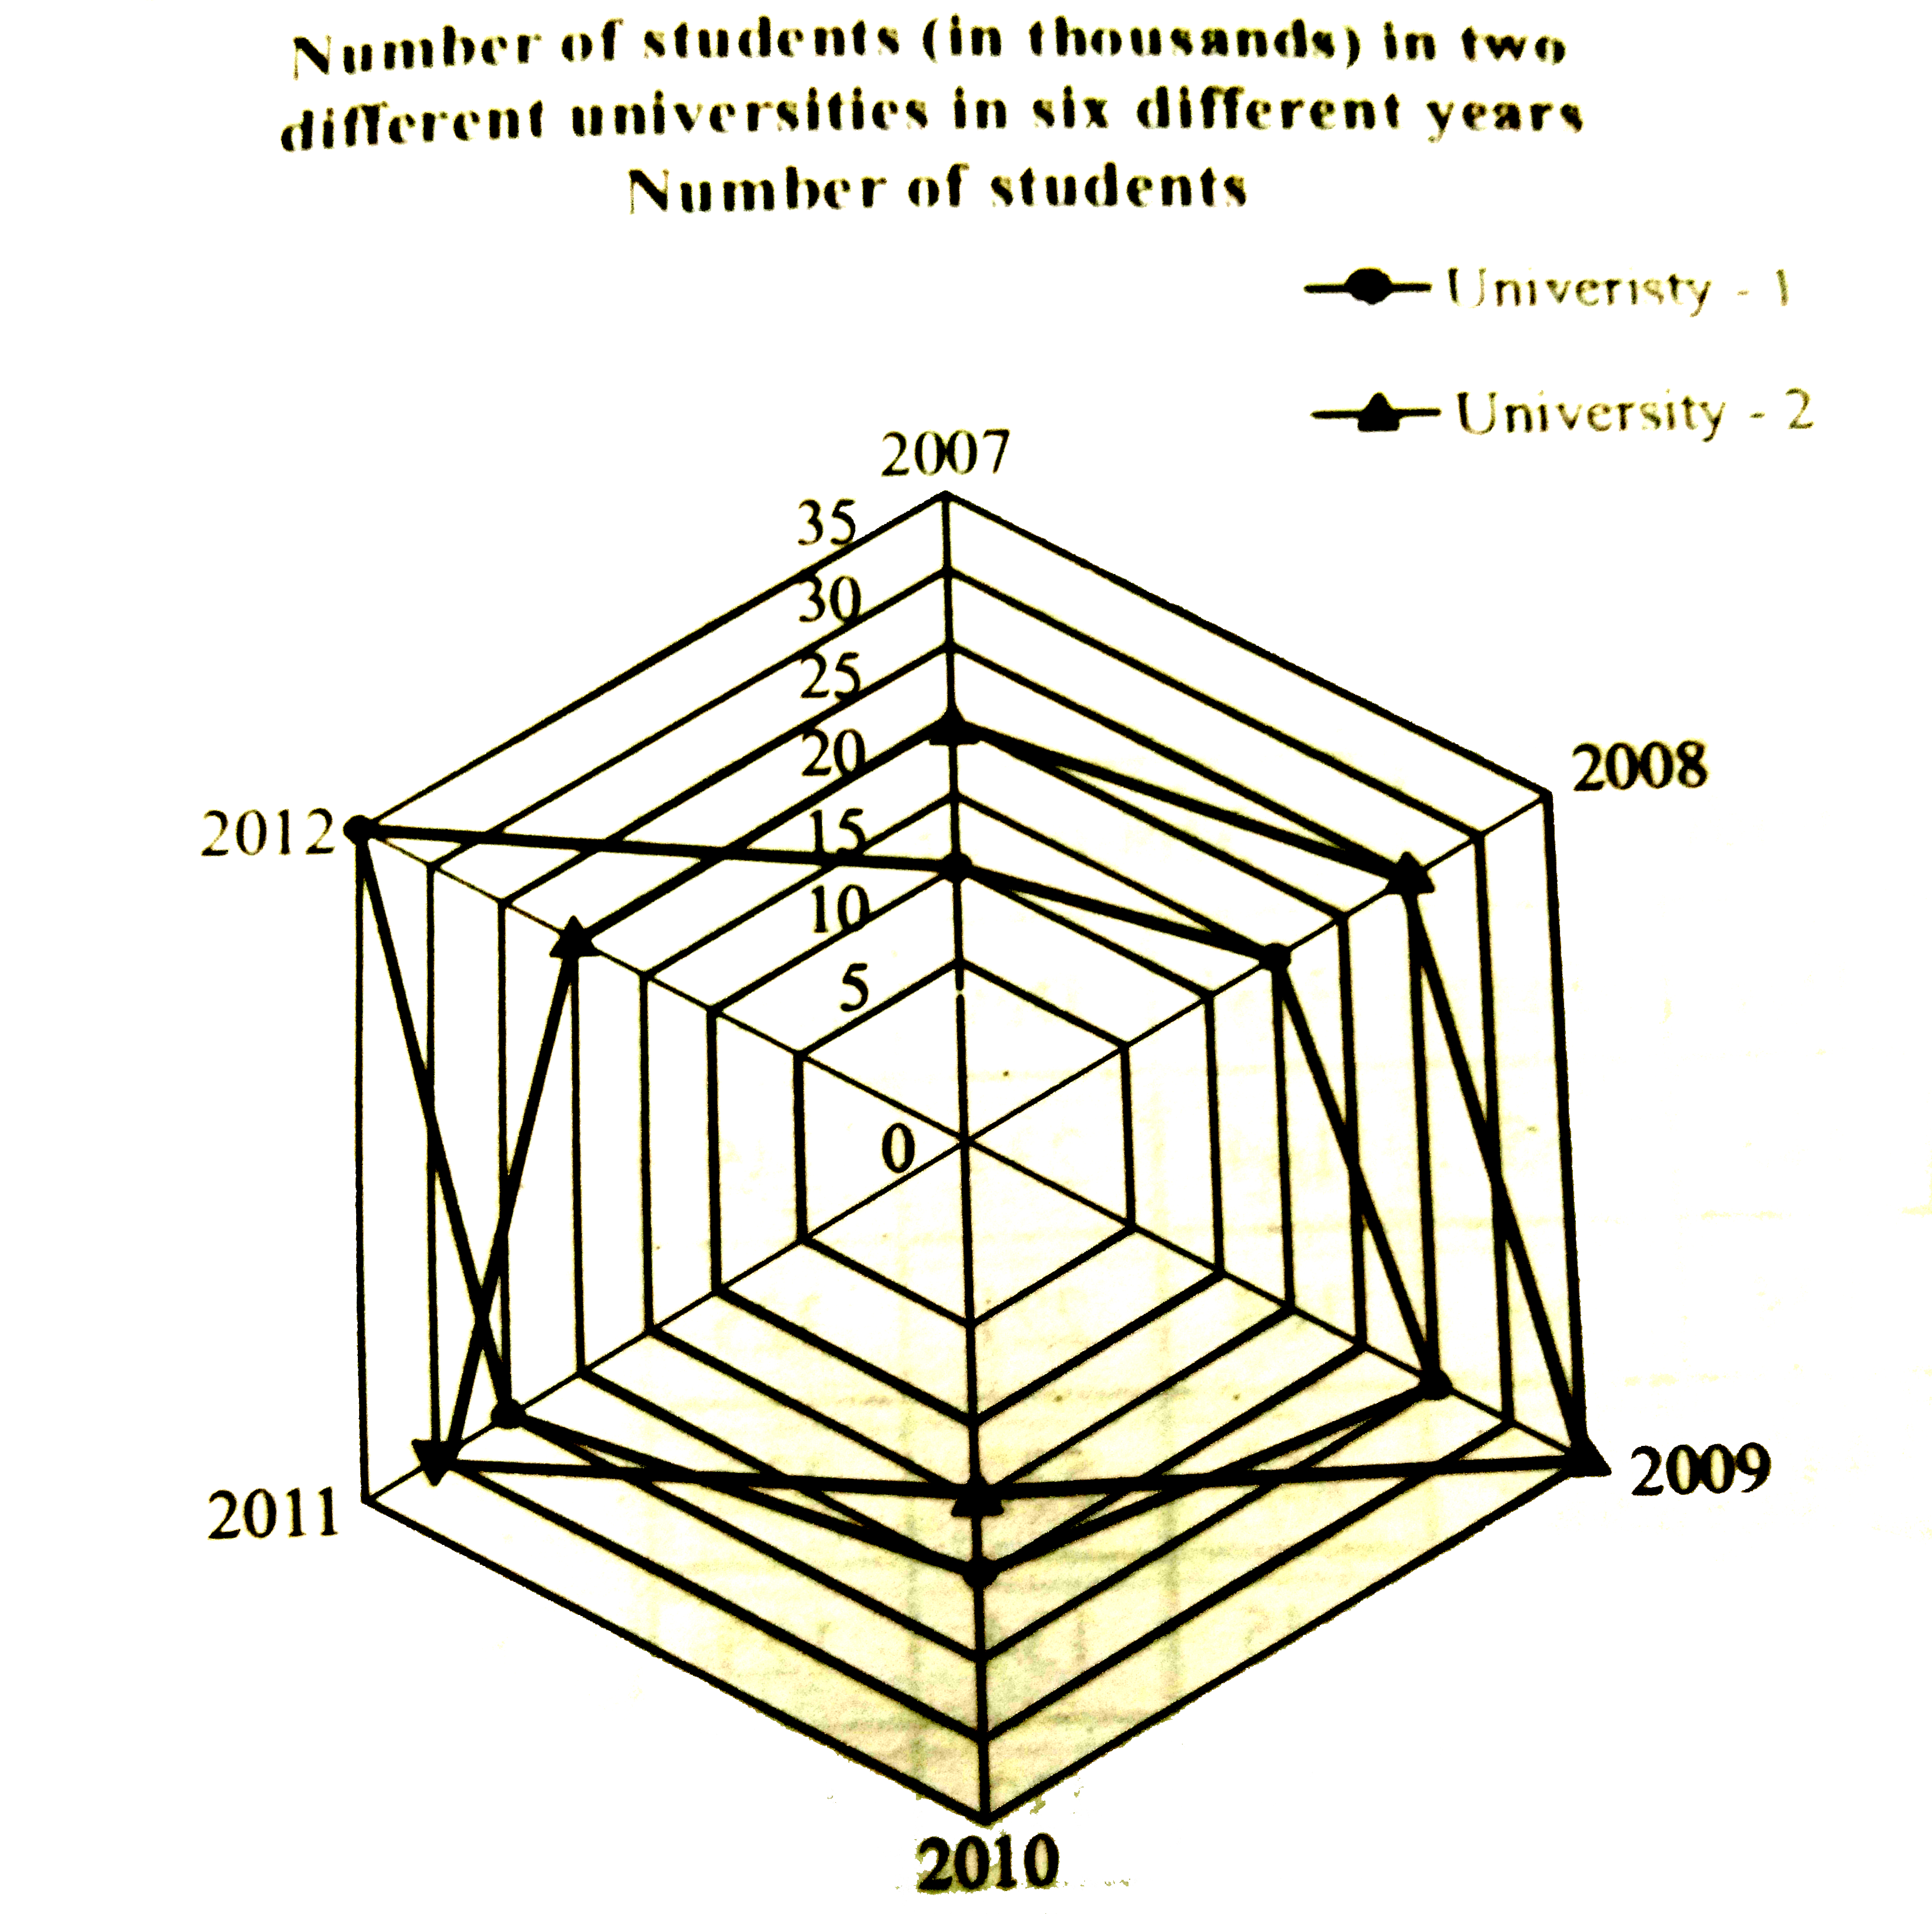
In which year was the difference between the number of students in university -I and the numer of students in university-2 highest?
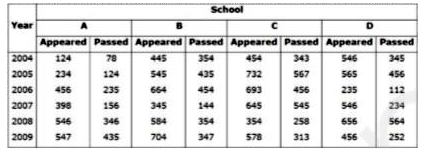
View SolutionIn which year was the difference between the number of candidates who appeared and passed in the exam from school - B second lowest?
View Solution
In which year was the difference between the number of students in university -I and the numer of students in university-2 highest?
View SolutionThe line graph shows the number of students who passed with distinction in the given years from a certain university. Study the diagram and answer the following questions.
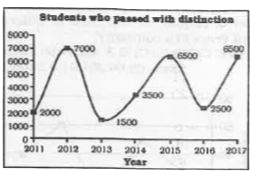
What was the difference between the number of students who passed with distinction between the years 2017 and 2014?
View Solution
