The table below shows the number of students enrolled in five colleges over the five years
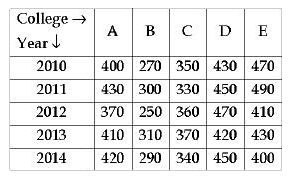
In the year 2014 what percent of students were enrolled in college C
16.9
17.8
16.7
19.1
The correct Answer is:B
Step by step video, text & image solution for The table below shows the number of students enrolled in five colleges over the five years In the year 2014 what percent of students were enrolled in college C by Maths experts to help you in doubts & scoring excellent marks in Class 14 exams.
Topper's Solved these Questions
Similar Questions
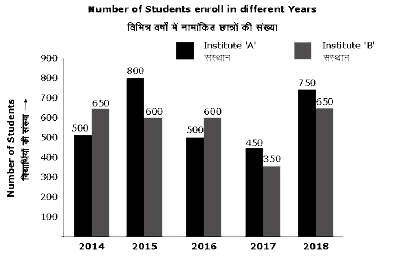
In the given bar graph, the number of students enrolled in institute b in the year 2016 is what percentage of students enrolled in institute A in 2016?
 View Solution
The table below shows the number of students enrolled in five colleges over the five years (2010 to 2014).
यह तालिका पांच कॉलेजों में पांच वर्षों ( 2010 से 2014 ) के दौरान नामांकन लेने वाले छात्रों की संख्या दर्शाती है |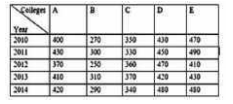 In the year 2014, what percent of students were enrolled in college C (correct to one decimal place)?
वर्ष 2014 में, कितने प्रतिशत छात्रों ने कॉलेज C में नामांकन करवाया था ? ( एक दशमलव स्थान तक )View Solution
Knowledge Check
- Question 1 - Select One
The table below shows the number of students enrolled in five colleges over the five years

What is the average number of students studying in college D over the given years?A450B420C430D444 - Question 2 - Select One
The table given below shows the number of students strudying in five colleges in the given five years.
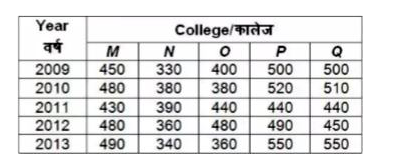
What is the ratio of the total number of students of college N in all years to the total number of students of all the colleges styding in the year 2011?A100 : 107B90 : 107C90 : 119D90 : 127 - Question 3 - Select One
The table given below shows the number of students strudying in five colleges in the given five years.
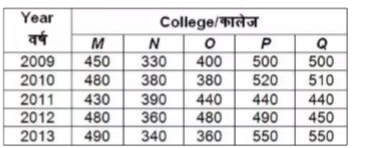
What is the average of the total number of students studying in college M in the given years?A412B420C400D466
The table given below shows the number of students enrolled in different courses of different colleges.
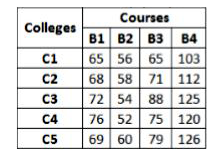
What is the difference in the total number of students enrolled in colleges C3 and C4?View SolutionThe table given below shows the number of students enrolled in different courses of different colleges.
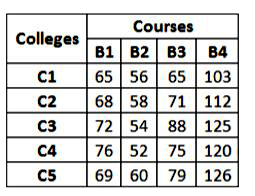
What is the average number of students per college enrolled in course B2?View SolutionThe table given below shows the number of students studying in five colleges in the given five years.
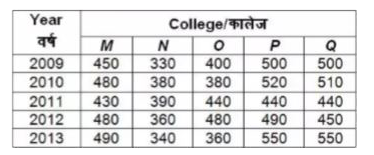
In which of the given years the average number of students studying is maximum?View SolutionThe table given below shows the number of students studying in five colleges in the given five years.
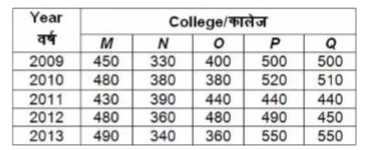
If in year 2011, in college N, 80% of the total students appeared in a exam, out of which 50% students passed, then how many students passed the exam?View Solution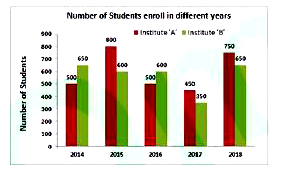
In the given bar graph, the number of students enrolled in institute B in the year 2016 is what percentage of students enrolled in institute A in 2016?View Solution
