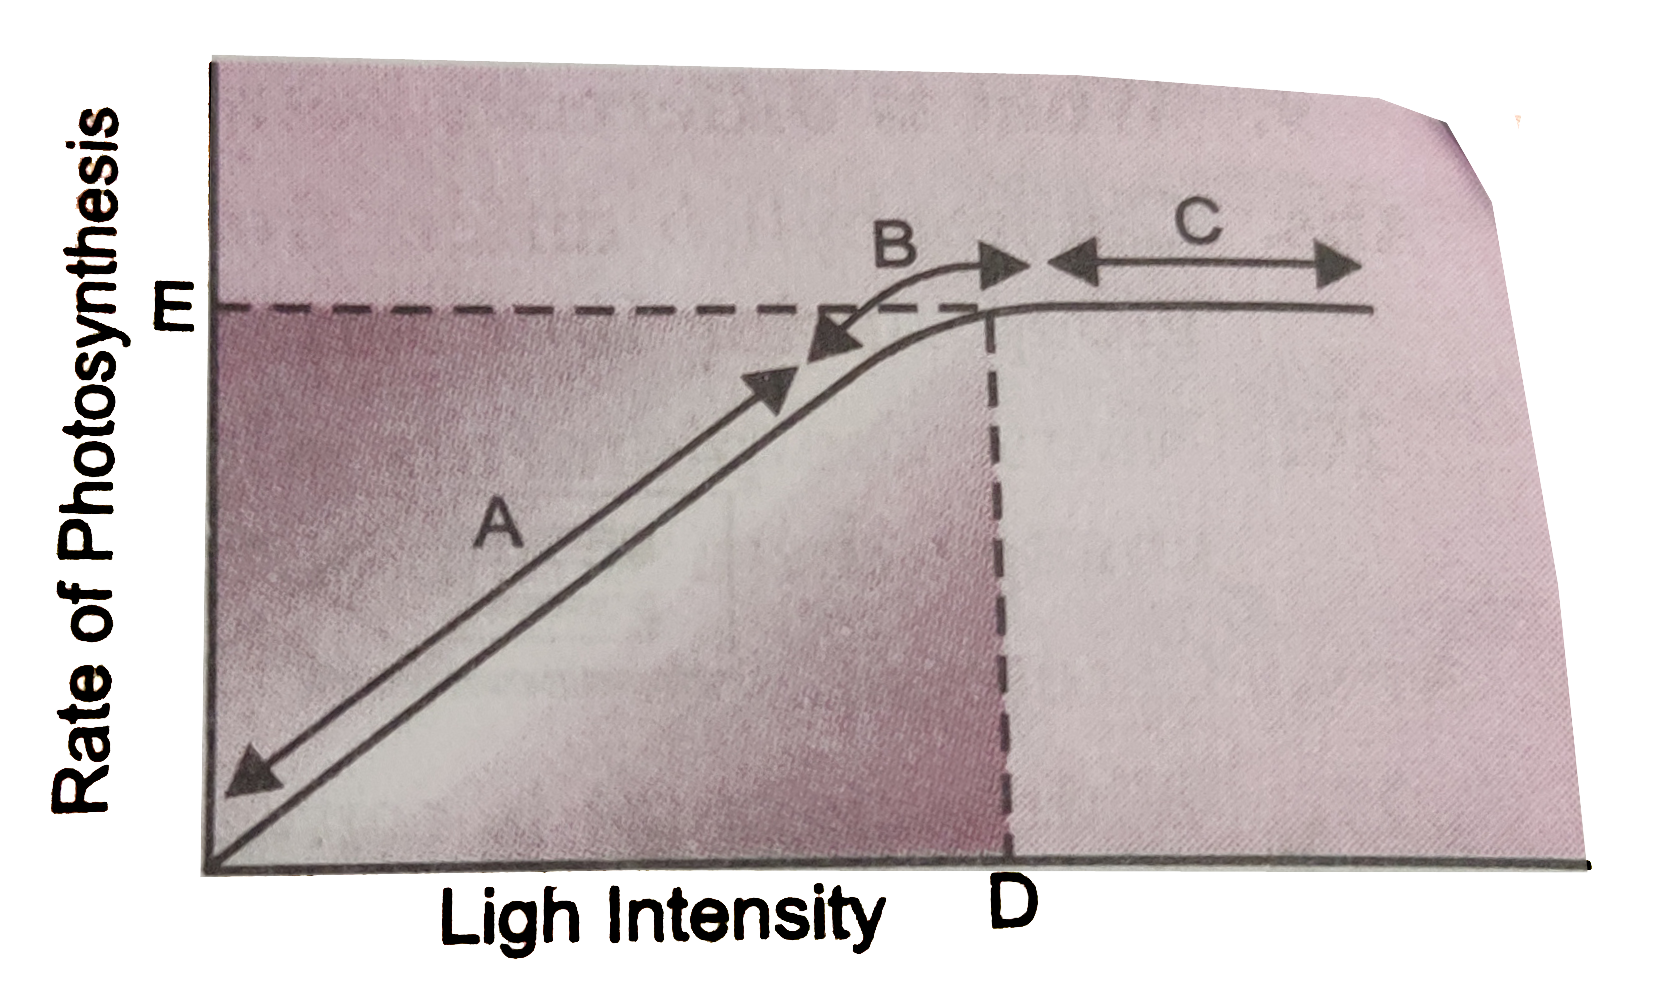
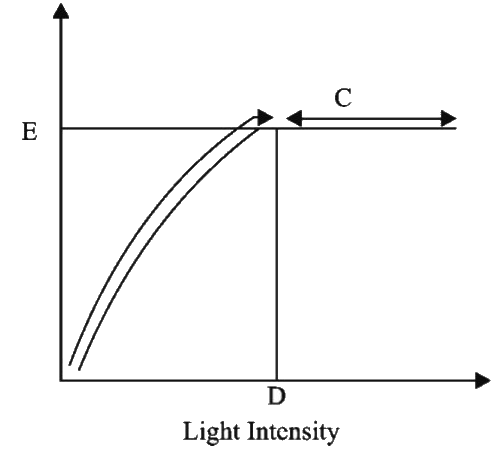
Figure shows the effect of light on the rate of photosynthesis.
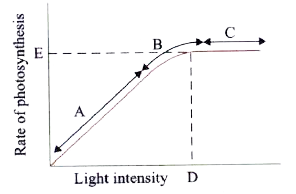
Based on the graph, answer the following questions.
What do C and D represent on the curve?
C represent that the rate of photosynthesis is not increased by increasing light intensity because some other factor may be limiting. D represents the intensity of light at which some other factor became limiting.
Topper's Solved these Questions
- NUTRITION IN PLANTS AND ANIMALS BOOK - CENGAGE BIOLOGYCHAPTER - NUTRITION IN PLANTS AND ANIMALS EXERCISE - OLYMPIAD AND NTSE LEVEL EXERCISES
10 Videos
- NERVOUS SYSTEM AND SENSE ORGANS : CONTROL AND CO-ORDINATIONBOOK - CENGAGE BIOLOGYCHAPTER - NERVOUS SYSTEM AND SENSE ORGANS : CONTROL AND CO-ORDINATIONEXERCISE - CHALLENGING EXERCISE
2 Videos
- REPRODUCTIONBOOK - CENGAGE BIOLOGYCHAPTER - REPRODUCTIONEXERCISE - CHALLENGING EXERCISE
3 Videos
Similar Questions
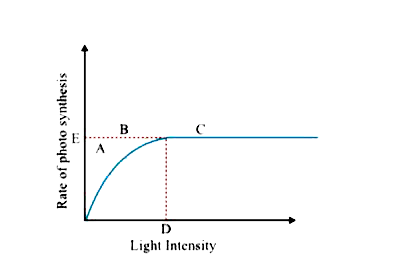
The figure shows the effect of light on the rate of photosynthesis. Based on the graph, answer the following questions :
What do region C and D represent on the curve ?
View SolutionFigure shows the effect of light on the rate of photosynthesis.
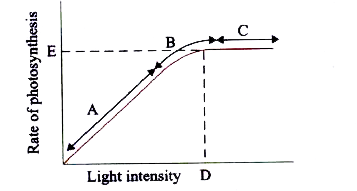
Based on the graph, answer the following questions.
At which point/s (A, B, or C) in the curve is light a limiting factor?
View Solution
Knowledge Check
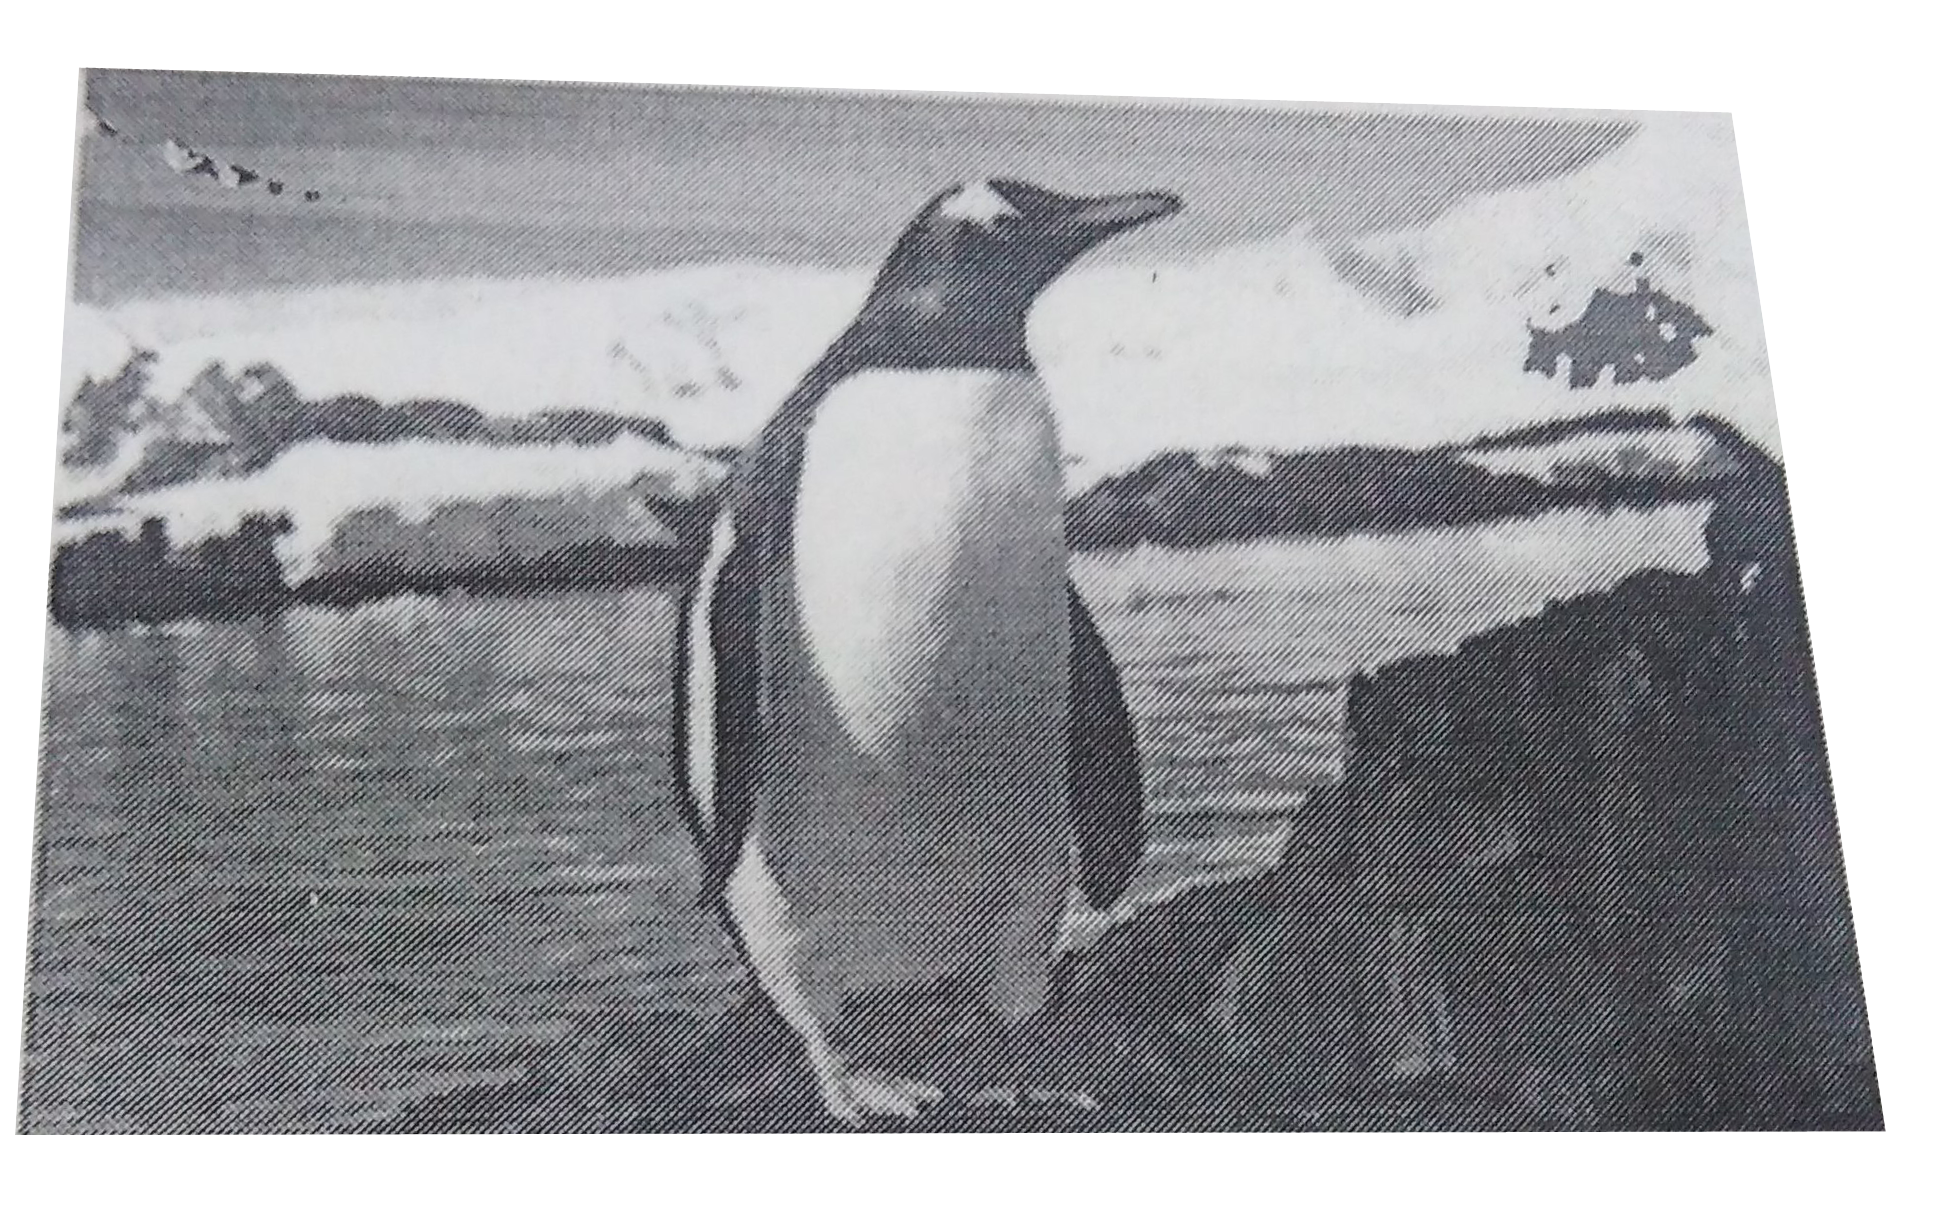
Answer the following questions based on the above figure.AIdentify the animal and its habitat.BMention the characteristic features for adaptation in the habitat.CMention any other animal which lives in the same habitat.DThe trees in these habitats are usually cone shaped. Give reason.
Figure shows, the effect of light on the rate of photosynthesis Based on the graph, answer the following questions.
a) At which points (A,B or C) in the curve is light a limiting factor?
b) What could be the limiting factor/s in region A?
c) What do C and D represent on the curve?
View SolutionFigure shows the effect of light on the rate of photosynthesis.
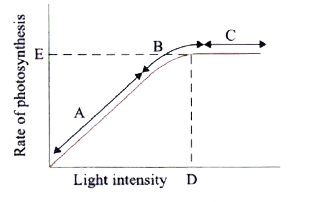
Based on the graph, answer the following questions.
What would be the limiting factors in region A?
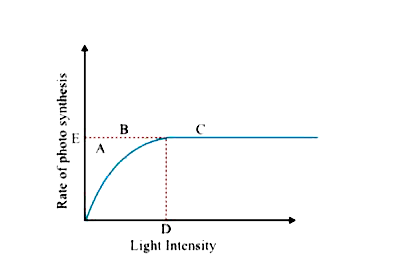
View SolutionThe figure shows the effect of light on the rate of photosynthesis. Based on the graph, answer the following questions :
What could be the limiting factor(s) in region A ?
View SolutionBased on the below diagram, answer the following question.
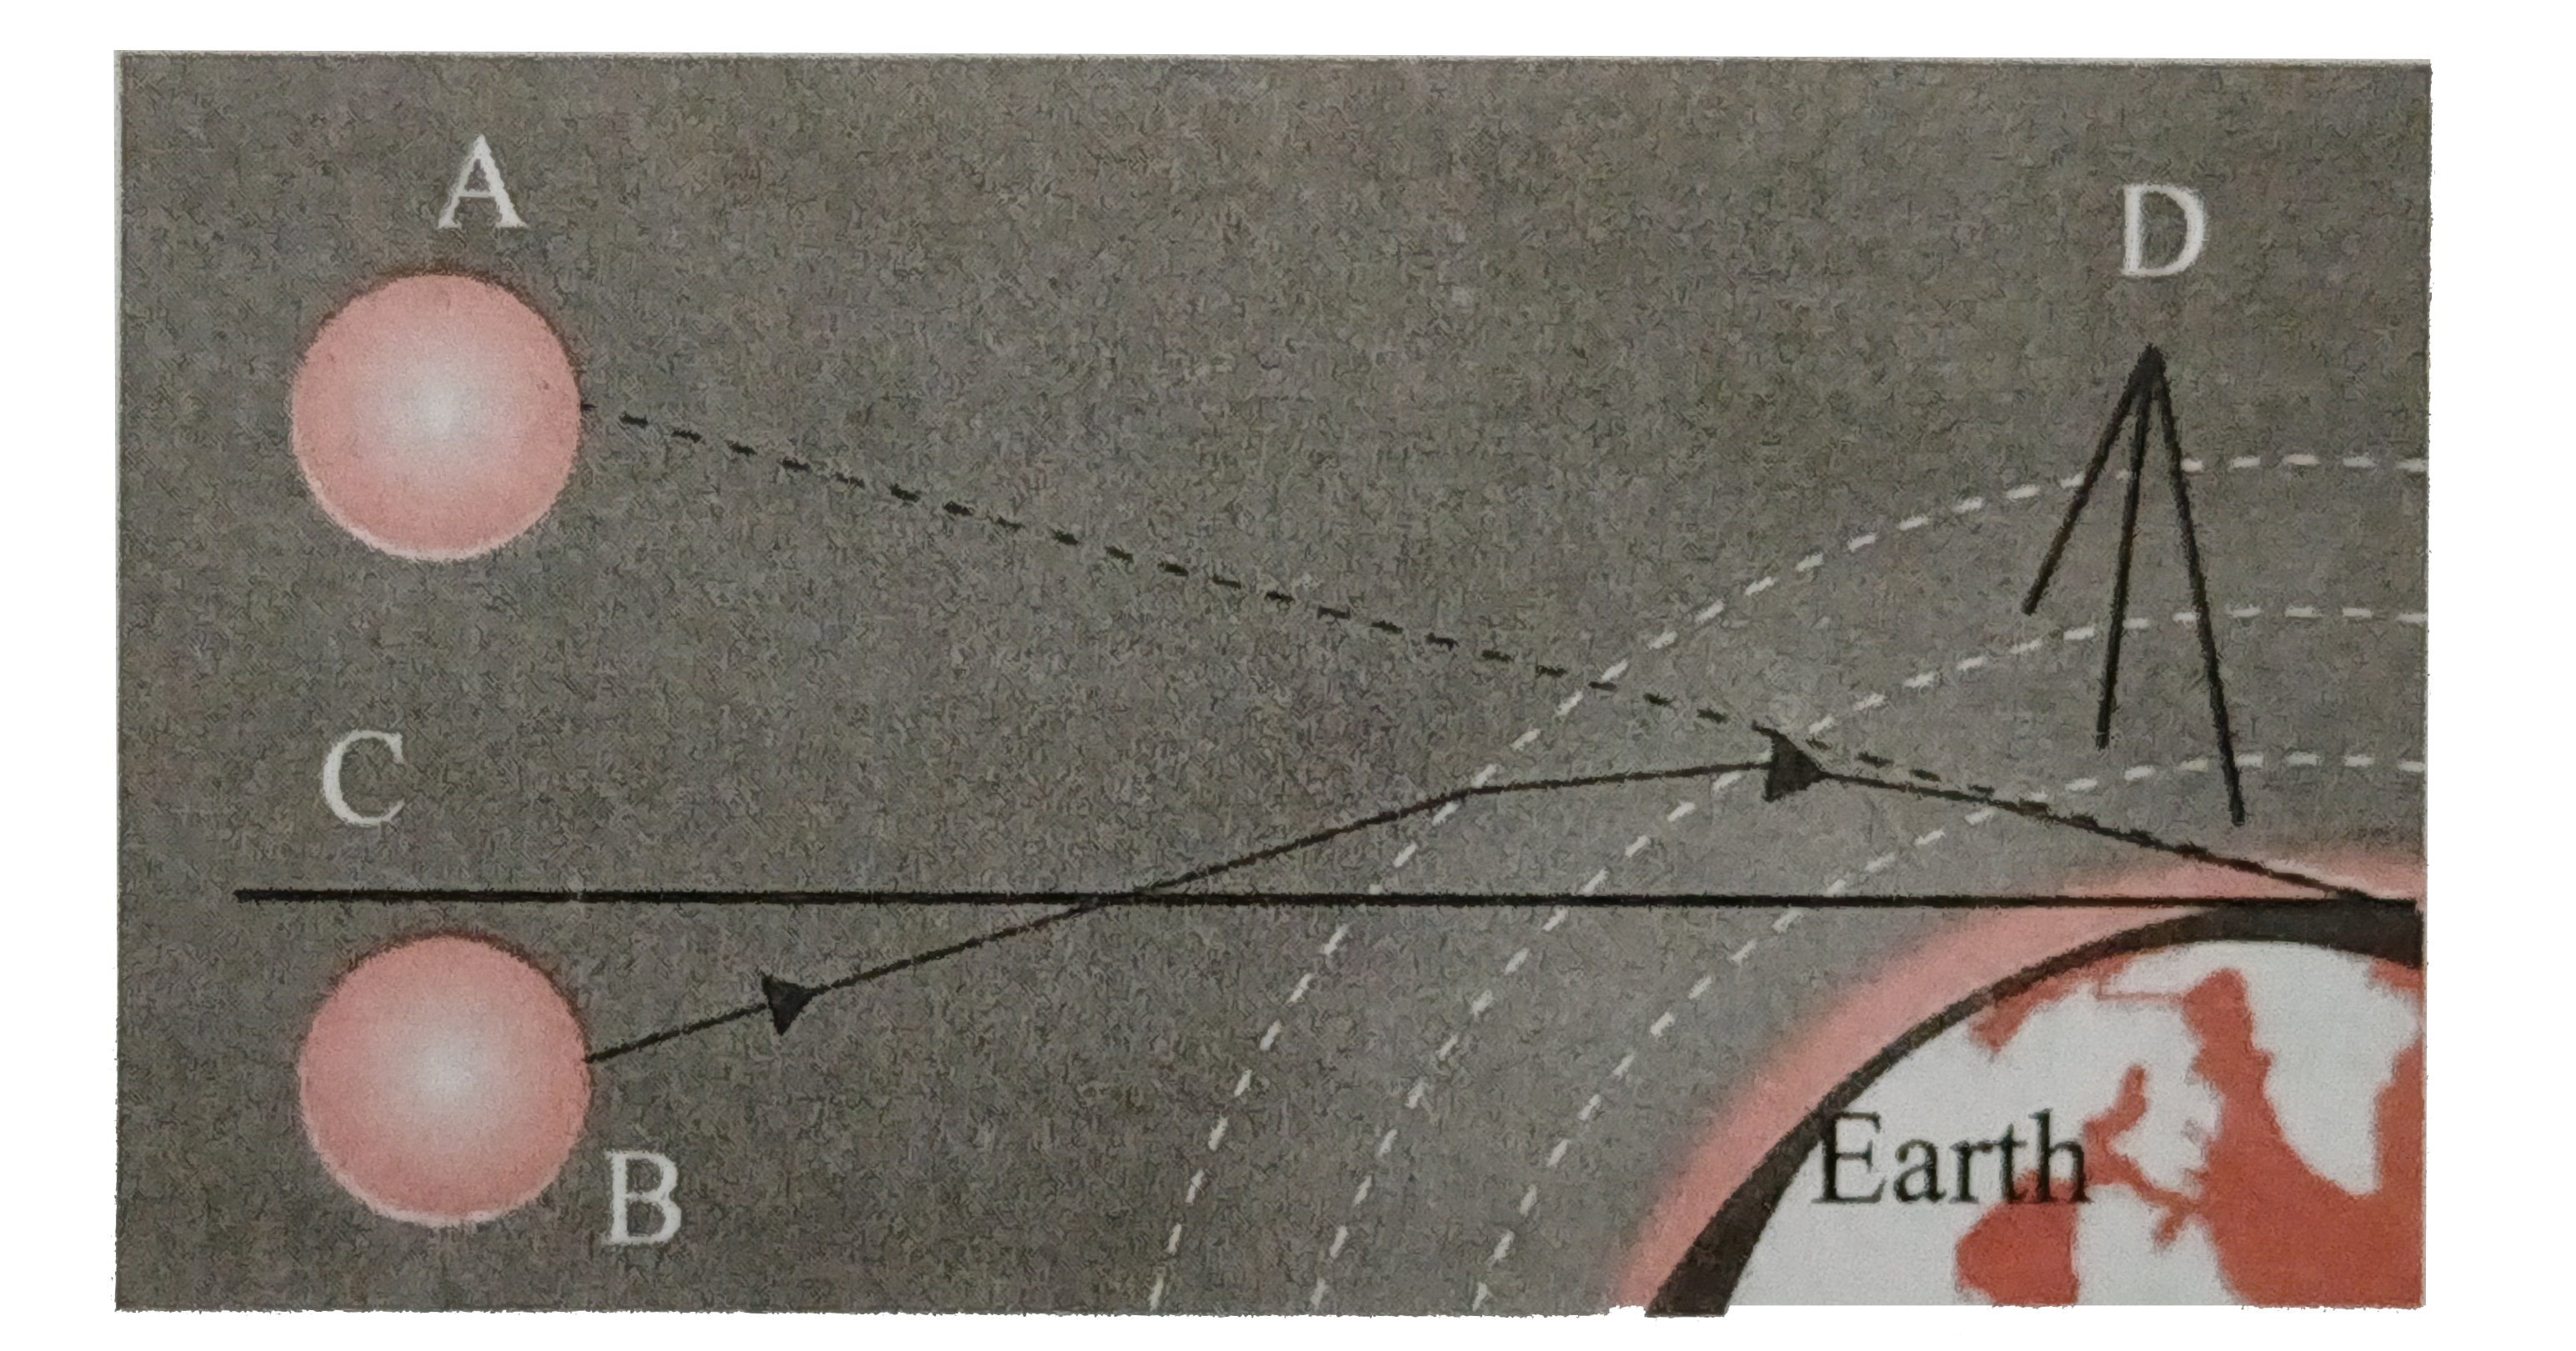
What do labels C and D denote?
View SolutionFigure given below shows the effect of light on the role of photosynthesis. Based on graph
What could be the limiting factor/factors in region A?
View SolutionRead the graph and answer the following questions
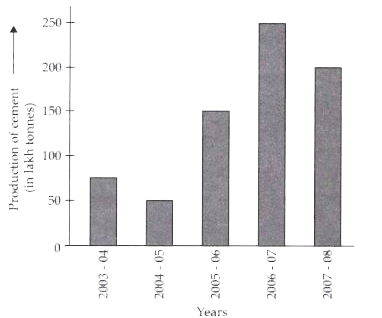
What information is conveyed by the bar graph
View SolutionFigure given below shows the effect of light on the role of photosynthesis. Based on graph
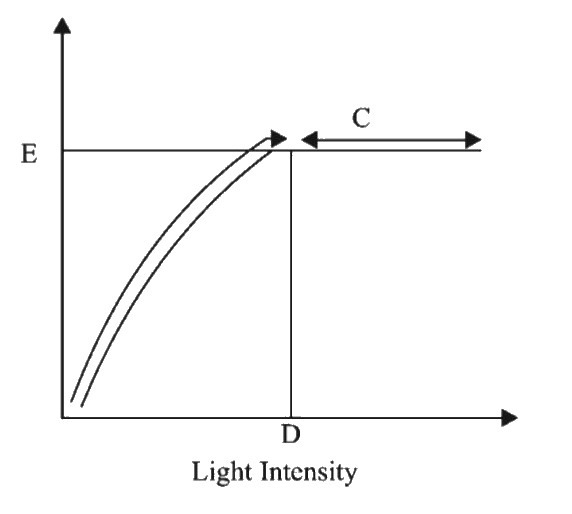
At which point/points (A,B or C) in the curve light is a limiting fac- tor?
View Solution
