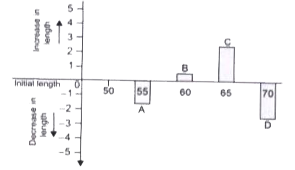
A graph was plotted between the initial length of strips and the change in length after osmosis after immersing four fresh strips of fresh potato A, B, C and D in solutions with varying concentrations. As the concentration was varying between cell sap and the ambient solution, osmosis occurred. Look ing at the graph, determine which of the strips was placed in the most diluted solution.

B
C
A
D
The correct Answer is:C
D
Related Playlists
- BOOK - CENGAGE BIOLOGYCHAPTER - CEL: THE BASIC UNIT OF LIFEEXERCISE - CHALLENGING EXERCISE4videos
CEL: THE BASIC UNIT OF LIFE
- BOOK - CENGAGE BIOLOGYCHAPTER - CEL: THE BASIC UNIT OF LIFEEXERCISE - CONSOLIDATED EXERCISE (Multiple Choice Questions with More Than One Correct Answer)64videos
CEL: THE BASIC UNIT OF LIFE
- BOOK - CENGAGE BIOLOGYCHAPTER - BIOLOGICAL CLASSIFICATION EXERCISE - CHALLENGING EXERCISE1videos
BIOLOGICAL CLASSIFICATION
- BOOK - CENGAGE BIOLOGYCHAPTER - CELL CYCLE AND CELL DIVISION EXERCISE - CHALLENGING EXERCISE6videos
CELL CYCLE AND CELL DIVISION
Similar Questions
Read the given passage and answer the questions :
Two solutions having same osmotic pressure at a given temperature are called isotonic solutions. When such solutions are separated by semipermeable membrane, no osmosis occurs between them. For example, the osmotic pressure associated with fluid inside the blood cell is equivalent to that of 0.9% (mass/volume) sodium chloride solution, called normal saline solution and it is safe to inject intravenously. On the other hand, if we place the cells in a solution containing more than 0.9% sodium chloride, water will flow out of the cells and they would shrink. Such a solution is called hypertonic. If the salt concentration is less than 0.9%, the solution is said to be hypotonic. In this case, water will flow into the cells if placed in this solution and they would swell.
Which concentration of sodium chloride solution is suitable for transfusion into blood ?View SolutionRead the given passage and answer the questions :
Two solutions having same osmotic pressure at a given temperature are called isotonic solutions. When such solutions are separated by semipermeable membrane, no osmosis occurs between them. For example, the osmotic pressure associated with fluid inside the blood cell is equivalent to that of 0.9% (mass/volume) sodium chloride solution, called normal saline solution and it is safe to inject intravenously. On the other hand, if we place the cells in a solution containing more than 0.9% sodium chloride, water will flow out of the cells and they would shrink. Such a solution is called hypertonic. If the salt concentration is less than 0.9%, the solution is said to be hypotonic. In this case, water will flow into the cells if placed in this solution and they would swell.
If a solution of 3 g of sodium chloride dissolved in 500 mL of water is injected into the body, what will happens to the blood cells ?View SolutionRead the given passage and answer the questions :
Two solutions having same osmotic pressure at a given temperature are called isotonic solutions. When such solutions are separated by semipermeable membrane, no osmosis occurs between them. For example, the osmotic pressure associated with fluid inside the blood cell is equivalent to that of 0.9% (mass/volume) sodium chloride solution, called normal saline solution and it is safe to inject intravenously. On the other hand, if we place the cells in a solution containing more than 0.9% sodium chloride, water will flow out of the cells and they would shrink. Such a solution is called hypertonic. If the salt concentration is less than 0.9%, the solution is said to be hypotonic. In this case, water will flow into the cells if placed in this solution and they would swell.
What is a hypertonic solution ?View SolutionRead the given passage and answer the questions :
Two solutions having same osmotic pressure at a given temperature are called isotonic solutions. When such solutions are separated by semipermeable membrane, no osmosis occurs between them. For example, the osmotic pressure associated with fluid inside the blood cell is equivalent to that of 0.9% (mass/volume) sodium chloride solution, called normal saline solution and it is safe to inject intravenously. On the other hand, if we place the cells in a solution containing more than 0.9% sodium chloride, water will flow out of the cells and they would shrink. Such a solution is called hypertonic. If the salt concentration is less than 0.9%, the solution is said to be hypotonic. In this case, water will flow into the cells if placed in this solution and they would swell.
What is a hypotonic solution ?View SolutionRead the given passage and answer the questions :
Two solutions having same osmotic pressure at a given temperature are called isotonic solutions. When such solutions are separated by semipermeable membrane, no osmosis occurs between them. For example, the osmotic pressure associated with fluid inside the blood cell is equivalent to that of 0.9% (mass/volume) sodium chloride solution, called normal saline solution and it is safe to inject intravenously. On the other hand, if we place the cells in a solution containing more than 0.9% sodium chloride, water will flow out of the cells and they would shrink. Such a solution is called hypertonic. If the salt concentration is less than 0.9%, the solution is said to be hypotonic. In this case, water will flow into the cells if placed in this solution and they would swell.
What is meant by isotonic solutions ?View SolutionRadha is a student of class X in a city school. One day Radha was doing practicals in the science laboratory of her school. Just then her science teacher, Mrs, Chopra, came to the laboratory with a beaker of a coourless solution. She told Radha that the colourless solution contains the nitrate of a metal which is usually alloyed with 24 carat gold to make 22 carat gold for ornaments. Mrs. Chopra asked Radha to device a method to obtain the dissolved metal from the solution in the solid form. Radha started thining about it. After some time Radha took a certain wire from the laboratory, cleaned it and placed it in the colourless solution in the beaker. She allowed this wire to remain immersed in the solution for a considerable time. Radha noticed a gradual change in the colour of solution in the beaker and saw a thick deposit of a substance on the wire kept in the solution. Radha was happy that she had done her job well.
(a) Name the metal whose nitrate solutioin you think is given in the bearker? Why do you think so?
(b) What was the nature of wire placed by Radha in the given solution? Why was this particular wire used?
(c) What change in the colour of solution was obsered by Radha in the beaker and why?
(d) Which substance was deposited on the wire placed in the solution?
(e) Which chemical reaction is utilised by Radha in this process? Why does this reaction occur?
(f) What values are displayed by Radha in this episode?View SolutionA system of greater disorder of molecules is more probable. The disorder of molecules is reflected by the entropy of the system. A liquid vapourizes to form a more disordered gas. When a solute is present, there is additional contribution to the entropy of the liquid due to increased randomness. As the entropy of solution is higher than that of pure liquid, there is weaker tendency to form the gas. Thus, a solute (non-volatile) lowers the vapour pressure of a liquid, and hence a higher boiling point of the solution.
Similarly, the greater randomness of the solution opposes the tendercy to freeze. In consequence, a lower temperature must be reached for achieving the equilibrium between the solid (frozen solvent) and the solution. The elevation in boiling point (ΔTb) and depression in freezing point (ΔTf) of a solution are the colligative properties which depend only on the concentration of particles of the solute and not their identity. For dilute solutions, (ΔTb) and (ΔTf) are proportional to the molarity of the solute in the solution.
A liquid possessing which of the following characteristics will be most suitable for determining the molecular mass of a compound by cryoscopic measurements?View SolutionThe properties of dilute or ideal soltions which depend only upon the concerntration of the solute in the solution and to other characteristics are known as colligative properties. There are in all four such properties i.e., relative lowering in vap[our pressure, osmotic pressure, elevation in boiling point tmperature and depression in freezing point temperature. All of them them in calculating the observed molar mass of the solute which is inversely propertional to the coligative property involved. Out of these, osmotic pressure may be regarded as the best for the determination of molecular mass of the solute. According to Van't Hoff theory of dilute solution. π=CRT, where π is the osmotic pressure while C is the molar concentration of the solution.
(8) When liquids A and B are mixed, hydrogen bonding occure. The solution will show.View Solution
Strong acid versus strong base:
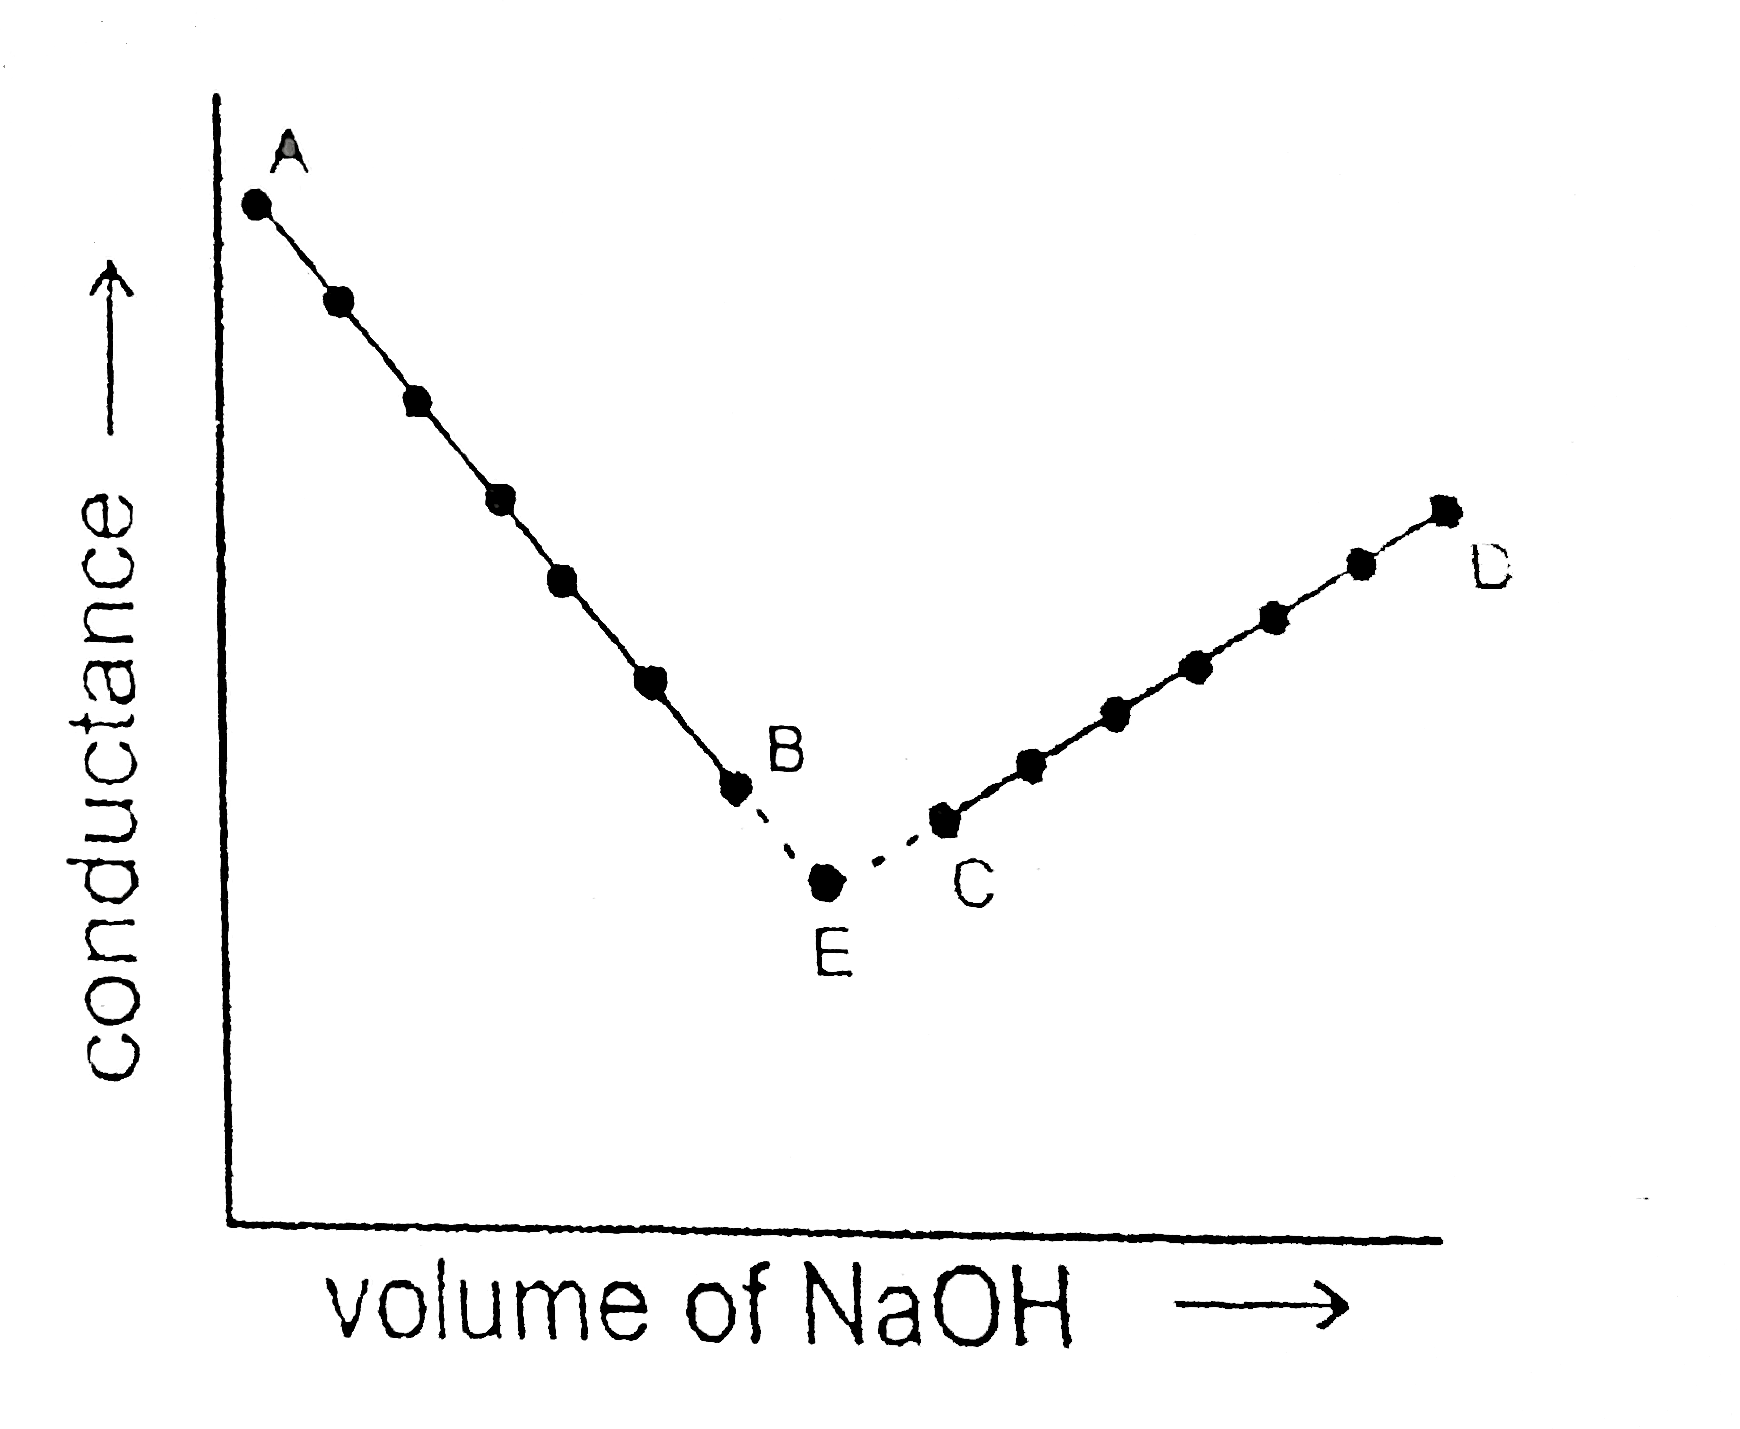
The principle of conductometric titrations is based on the fact that during the titration, one of the ions is replaced by the other and invariable these two ions differ in the ionic conductivity with the result that thhe conductivity of the solution varies during the course of the titration. take, for example, the titration between a strong acid, say HCl, and a string base, say NaOH before NaOH is added, the conductance of HCl solution has a high value due to the presence of highly mobile hydrogen ions. As NaOH is added, H+ ions are replaced by relatively slower moving Na+ ions. consequently the conductance of the solution decreases and this continues right upto the equivalence point where the solution contains only NaCl. Beyond the equivalence point, if more of NaOH is added, then the solution contains a excess of the fast moving OH− ions with the result that its conductance is increased ad it condinues to increase as more and more of NaOH is added. If we plot the conductance value versus the amount of NaOH added, we get a curve of the type shown in Fig. The descending portion AB represents the conductances before the equivalence point (solution contains a mixture of acid HCl and the salt NaCl) and the ascending portion CD represents the conductances after the equivalence point (solution contains the salt NaCl and the excess of NaOH). The point E which represent the minium conductance is due to the solution containing only NaCl with no free acid or alkali and thus represents the equivalence point. this point can, however, be obtained by the extrapolation of the lines AB and DC, and therefore, one is not very particular in locating this point expermentally as it is in the case of ordinary acid-base titrations involving the acid-base indicators.
Weak acid versus strong base:
Let us take specific example of acetic acid being titrated against NaOH. Before the addition of alkali, the solution shows poor conductance due to feeble ionization of acetic acid. Initially the addition of alkali causes not only the replacement of H+ by Na+ but also suppresses the dissociation of acetic acid due to the common ion Ac− and thus the conductance of the solution decreases in the beginning. but very soon the conductance start increasing as addition of NaOH neutralizes the undissociated HAc to Na+Ac− thus causing the replacement of non-conducting HAc with Strong-conducting electrolyte Na+Ac−. the increase in conductance continuous right up to the equivalence point. Beyond this point conductance increases more rapidly with the addition of NaOH due to the highly conducting OH− ions, the graph near the equivalence point is curved due to the hydrolysis of the salt NaAc. The actual equivalence point can, as usual, be obtained by the extrapolation method.
In all these graphs it has been assumed that the volume change due addition of solution from burrette is negnigible, hence volume change of the solution in beaker the conductance of which is measured is almost constant throughout the measurement.
Q. The nature of curve obtained for the titration between weak acid versus strong base as described in the above passage will be:View Solution
Strong acid versus strong base:
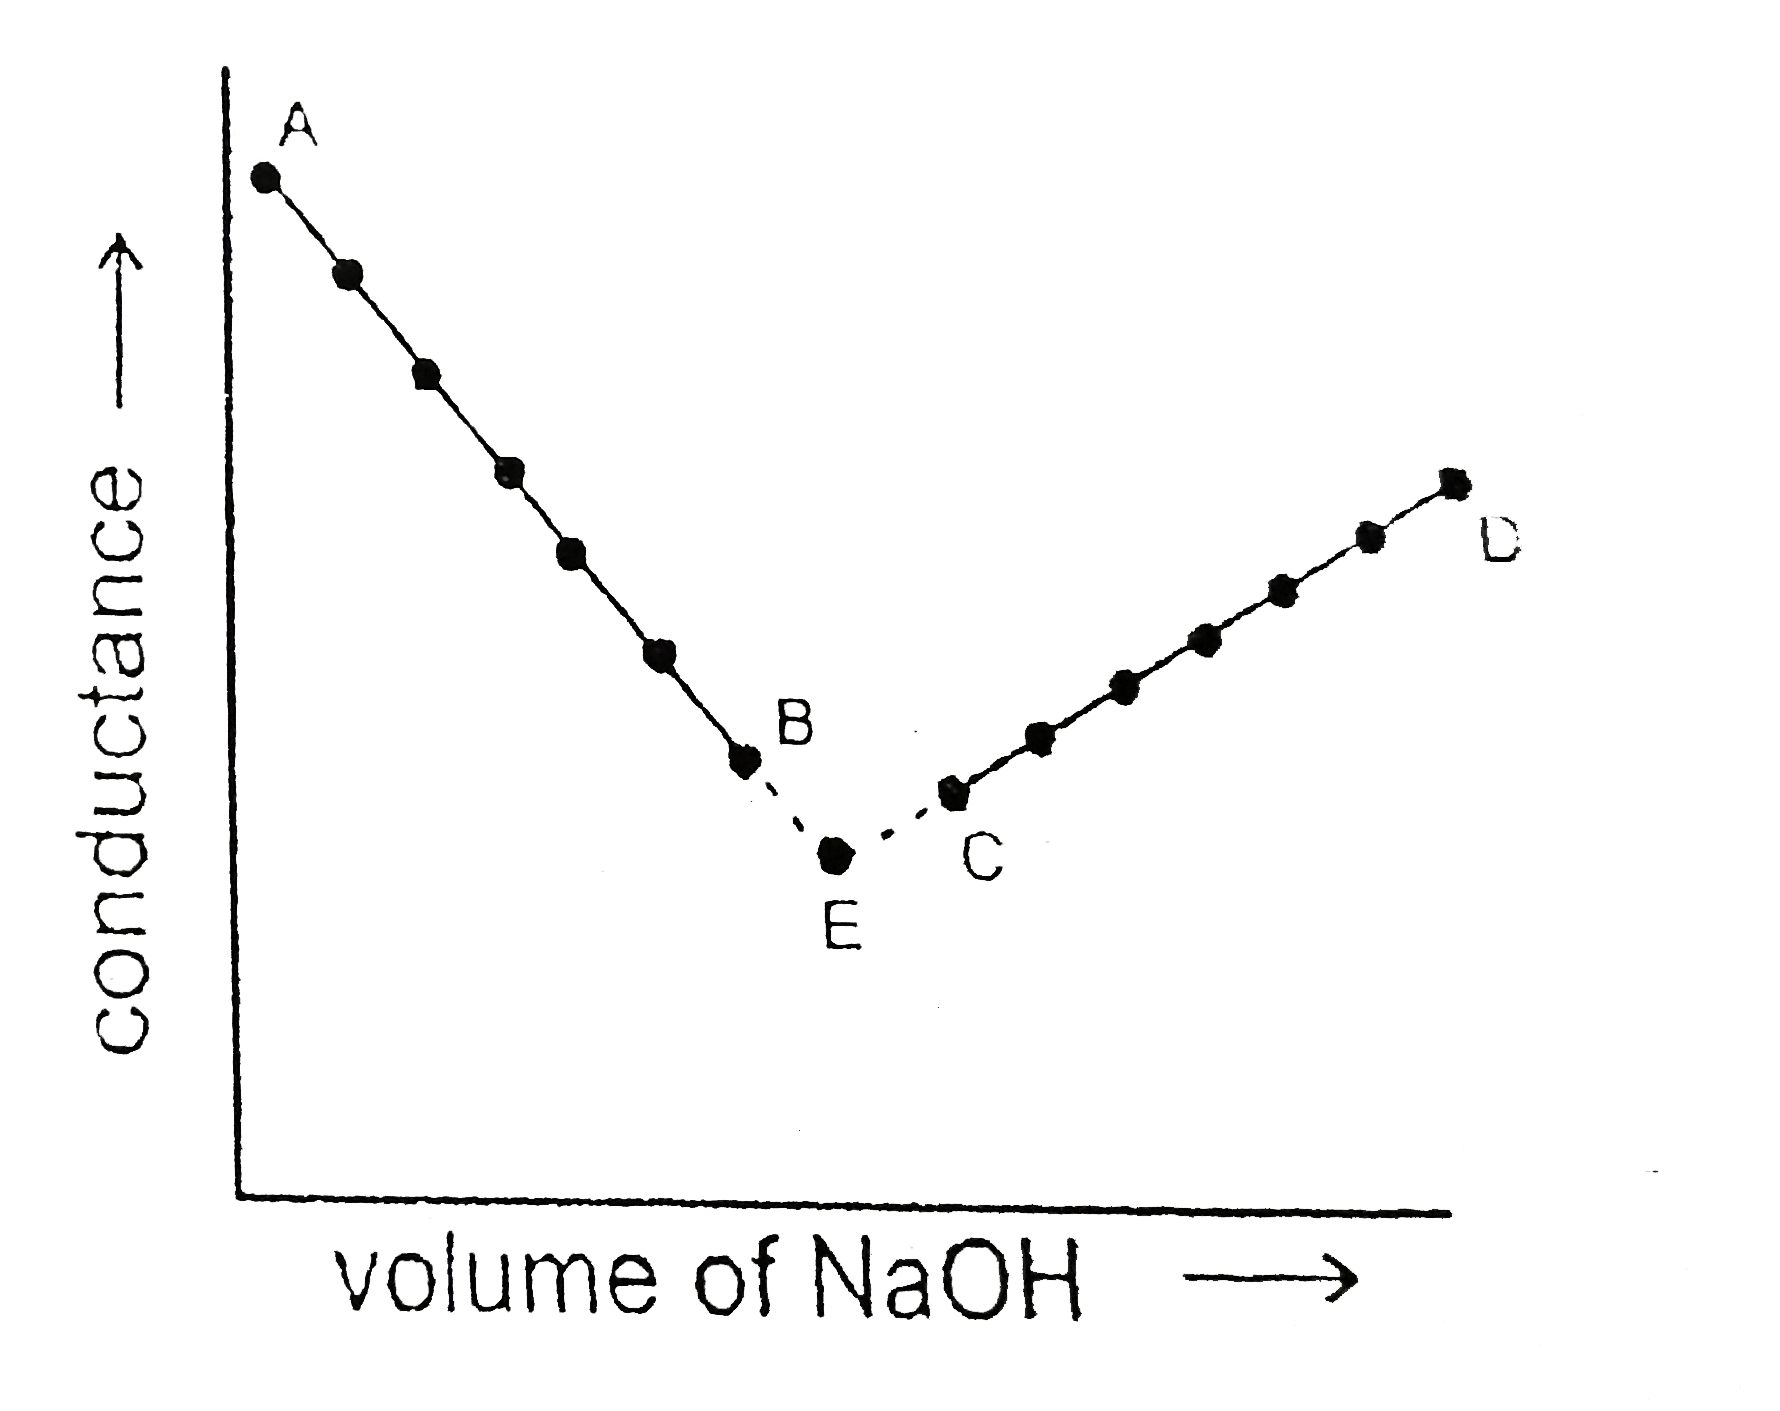
The principle of conductometric titrations is based on the fact that during the titration, one of the ions is replaced by the other and invariable these two ions differ in the ionic conductivity with the result that thhe conductivity of the solution varies during the course of the titration. take, for example, the titration between a strong acid, say HCl, and a string base, say NaOH before NaOH is added, the conductance of HCl solution has a high value due to the presence of highly mobile hydrogen ions. As NaOH is added, H+ ions are replaced by relatively slower moving Na+ ions. consequently the conductance of the solution decreases and this continues right upto the equivalence point where the solution contains only NaCl. Beyond the equivalence point, if more of NaOH is added, then the solution contains a excess of the fast moving OH− ions with the result that its conductance is increased ad it condinues to increase as more and more of NaOH is added. If we plot the conductance value versus the amount of NaOH added, we get a curve of the type shown in Fig. The descending portion AB represents the conductances before the equivalence point (solution contains a mixture of acid HCl and the salt NaCl) and the ascending portion CD represents the conductances after the equivalence point (solution contains the salt NaCl and the excess of NaOH). The point E which represent the minium conductance is due to the solution containing only NaCl with no free acid or alkali and thus represents the equivalence point. this point can, however, be obtained by the extrapolation of the lines AB and DC, and therefore, one is not very particular in locating this point expermentally as it is in the case of ordinary acid-base titrations involving the acid-base indicators.
Weak acid versus strong base:
Let us take specific example of acetic acid being titrated against NaOH. Before the addition of alkali, the solution shows poor conductance due to feeble ionization of acetic acid. Initially the addition of alkali causes not only the replacement of H+ by Na+ but also suppresses the dissociation of acetic acid due to the common ion Ac− and thus the conductance of the solution decreases in the beginning. but very soon the conductance start increasing as addition of NaOH neutralizes the undissociated HAc to Na+Ac− thus causing the replacement of non-conducting HAc with Strong-conducting electrolyte Na+Ac−. the increase in conductance continuous right up to the equivalence point. Beyond this point conductance increases more rapidly with the addition of NaOH due to the highly conducting OH− ions, the graph near the equivalence point is curved due to the hydrolysis of the salt NaAc. The actual equivalence point can, as usual, be obtained by the extrapolation method.
In all these graphs it has been assumed that the volume change due addition of solution from burrette is negnigible, hence volume change of the solution in beaker the conductance of which is measured is almost constant throughout the measurement.
Q. The most appropriate titration curve obtained when a mixture of a strong acid (say HCl) and a weak acid (say CH3COOH) is titrated with a strong base (say NaOH) will beView Solution


