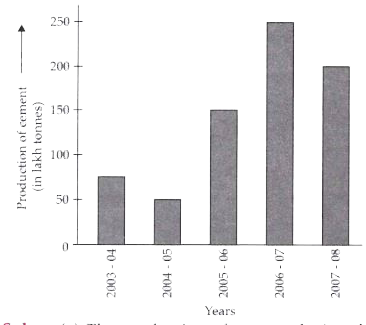
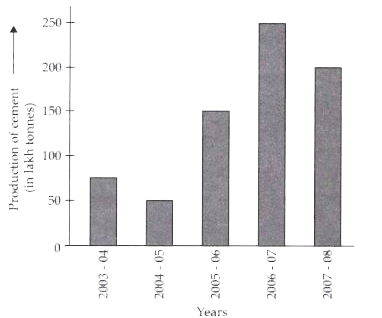
Read the graph and answer the following questions
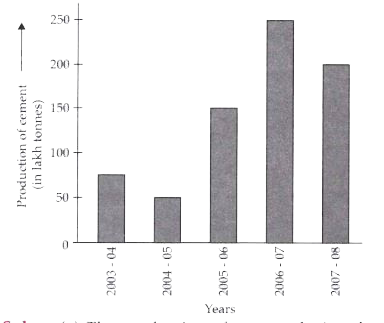
What was the production of cement in the year 2006-07 ?
The correct Answer is:250 lakh tonnes
Step by step video, text & image solution for Read the graph and answer the following questions What was the production of cement in the year 2006-07 ? by Maths experts to help you in doubts & scoring excellent marks in Class 7 exams.
Topper's Solved these Questions
- BOOK - MTG IIT JEE FOUNDATIONCHAPTER - DATA HANDLINGEXERCISE - NCERT Section (Exercise - 3 .1 )23videos
DATA HANDLING
- BOOK - MTG IIT JEE FOUNDATIONCHAPTER - DATA HANDLINGEXERCISE - NCERT Section (Exercise - 3 .2 )9videos
DATA HANDLING
- BOOK - MTG IIT JEE FOUNDATIONCHAPTER - DATA HANDLINGEXERCISE - Olympiad / Hots Corner20videos
DATA HANDLING
- BOOK - MTG IIT JEE FOUNDATIONCHAPTER - CONGRUENCE OF TRIANGLES EXERCISE - Olympiad/HOTS Corner10videos
CONGRUENCE OF TRIANGLES
- BOOK - MTG IIT JEE FOUNDATIONCHAPTER - EXPONENTS AND POWERSEXERCISE - OLYMPIAD/HOTS CORNER15videos
EXPONENTS AND POWERS
Similar Questions
Knowledge Check
- Question 1 - Select One
Observe the graph below and answer the following question.
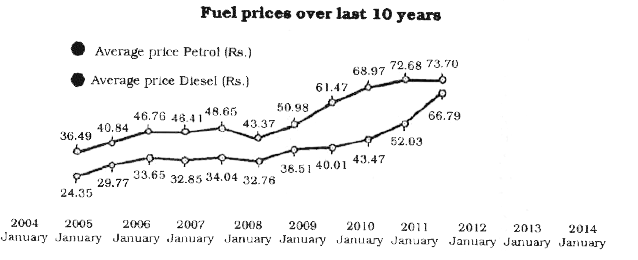
What is the average of diesel prices over the years 2006-2012?A36.47B37.34C35.67D38.77 - Question 2 - Select One
The following graph shows the production of cotton bales of 100 kg each in lakhs by different states A, B, C, D and E over the years. Study the graph and answer the following Questions.
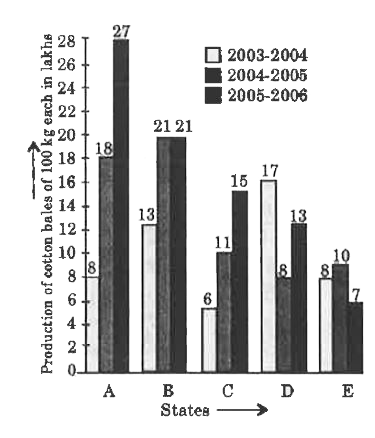
The number of States for which s the production of cotton in 2005 2006 is less than or equal to the preceding year isA3B2C1DThere is no such States - Question 3 - Select One
Study the graph carefully and answer the following questions.
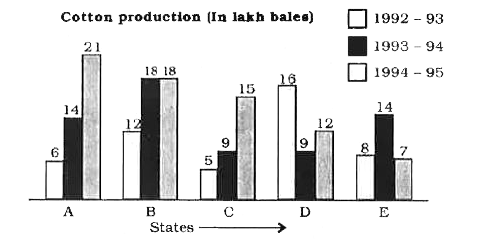
What is the average production of the four states in the year 1994-95 taken together ?A12.3B14.6C15.6D16.3
The following graph shows the production of cotton bales of 100 kg each (in lakhs) by different states A, B, C, D and E over the years. Study the graph and answer the following Questions.
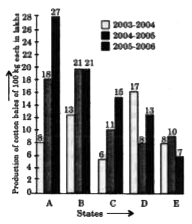
The number of State for which the production of cotton in 2005-2006 is less than or equal to the preceding year isView SolutionRead the graph and answer the following questions
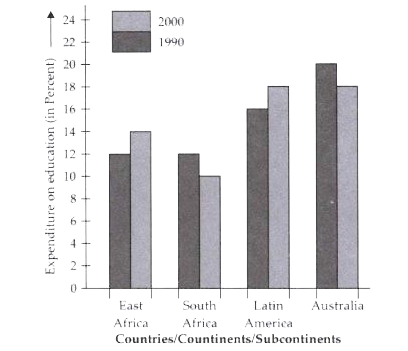
Give a suitable title to bar graphView SolutionObserve the graph below and answer the following question
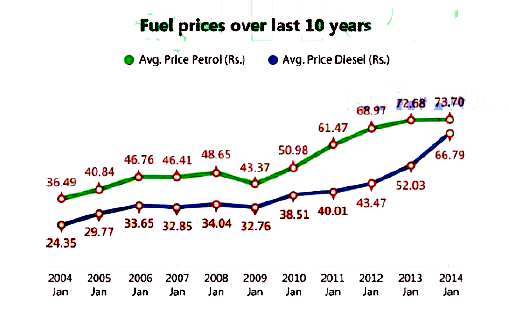
What is the average of diesel prices over the years 20062012?View SolutionRead the following graph and answer the following question
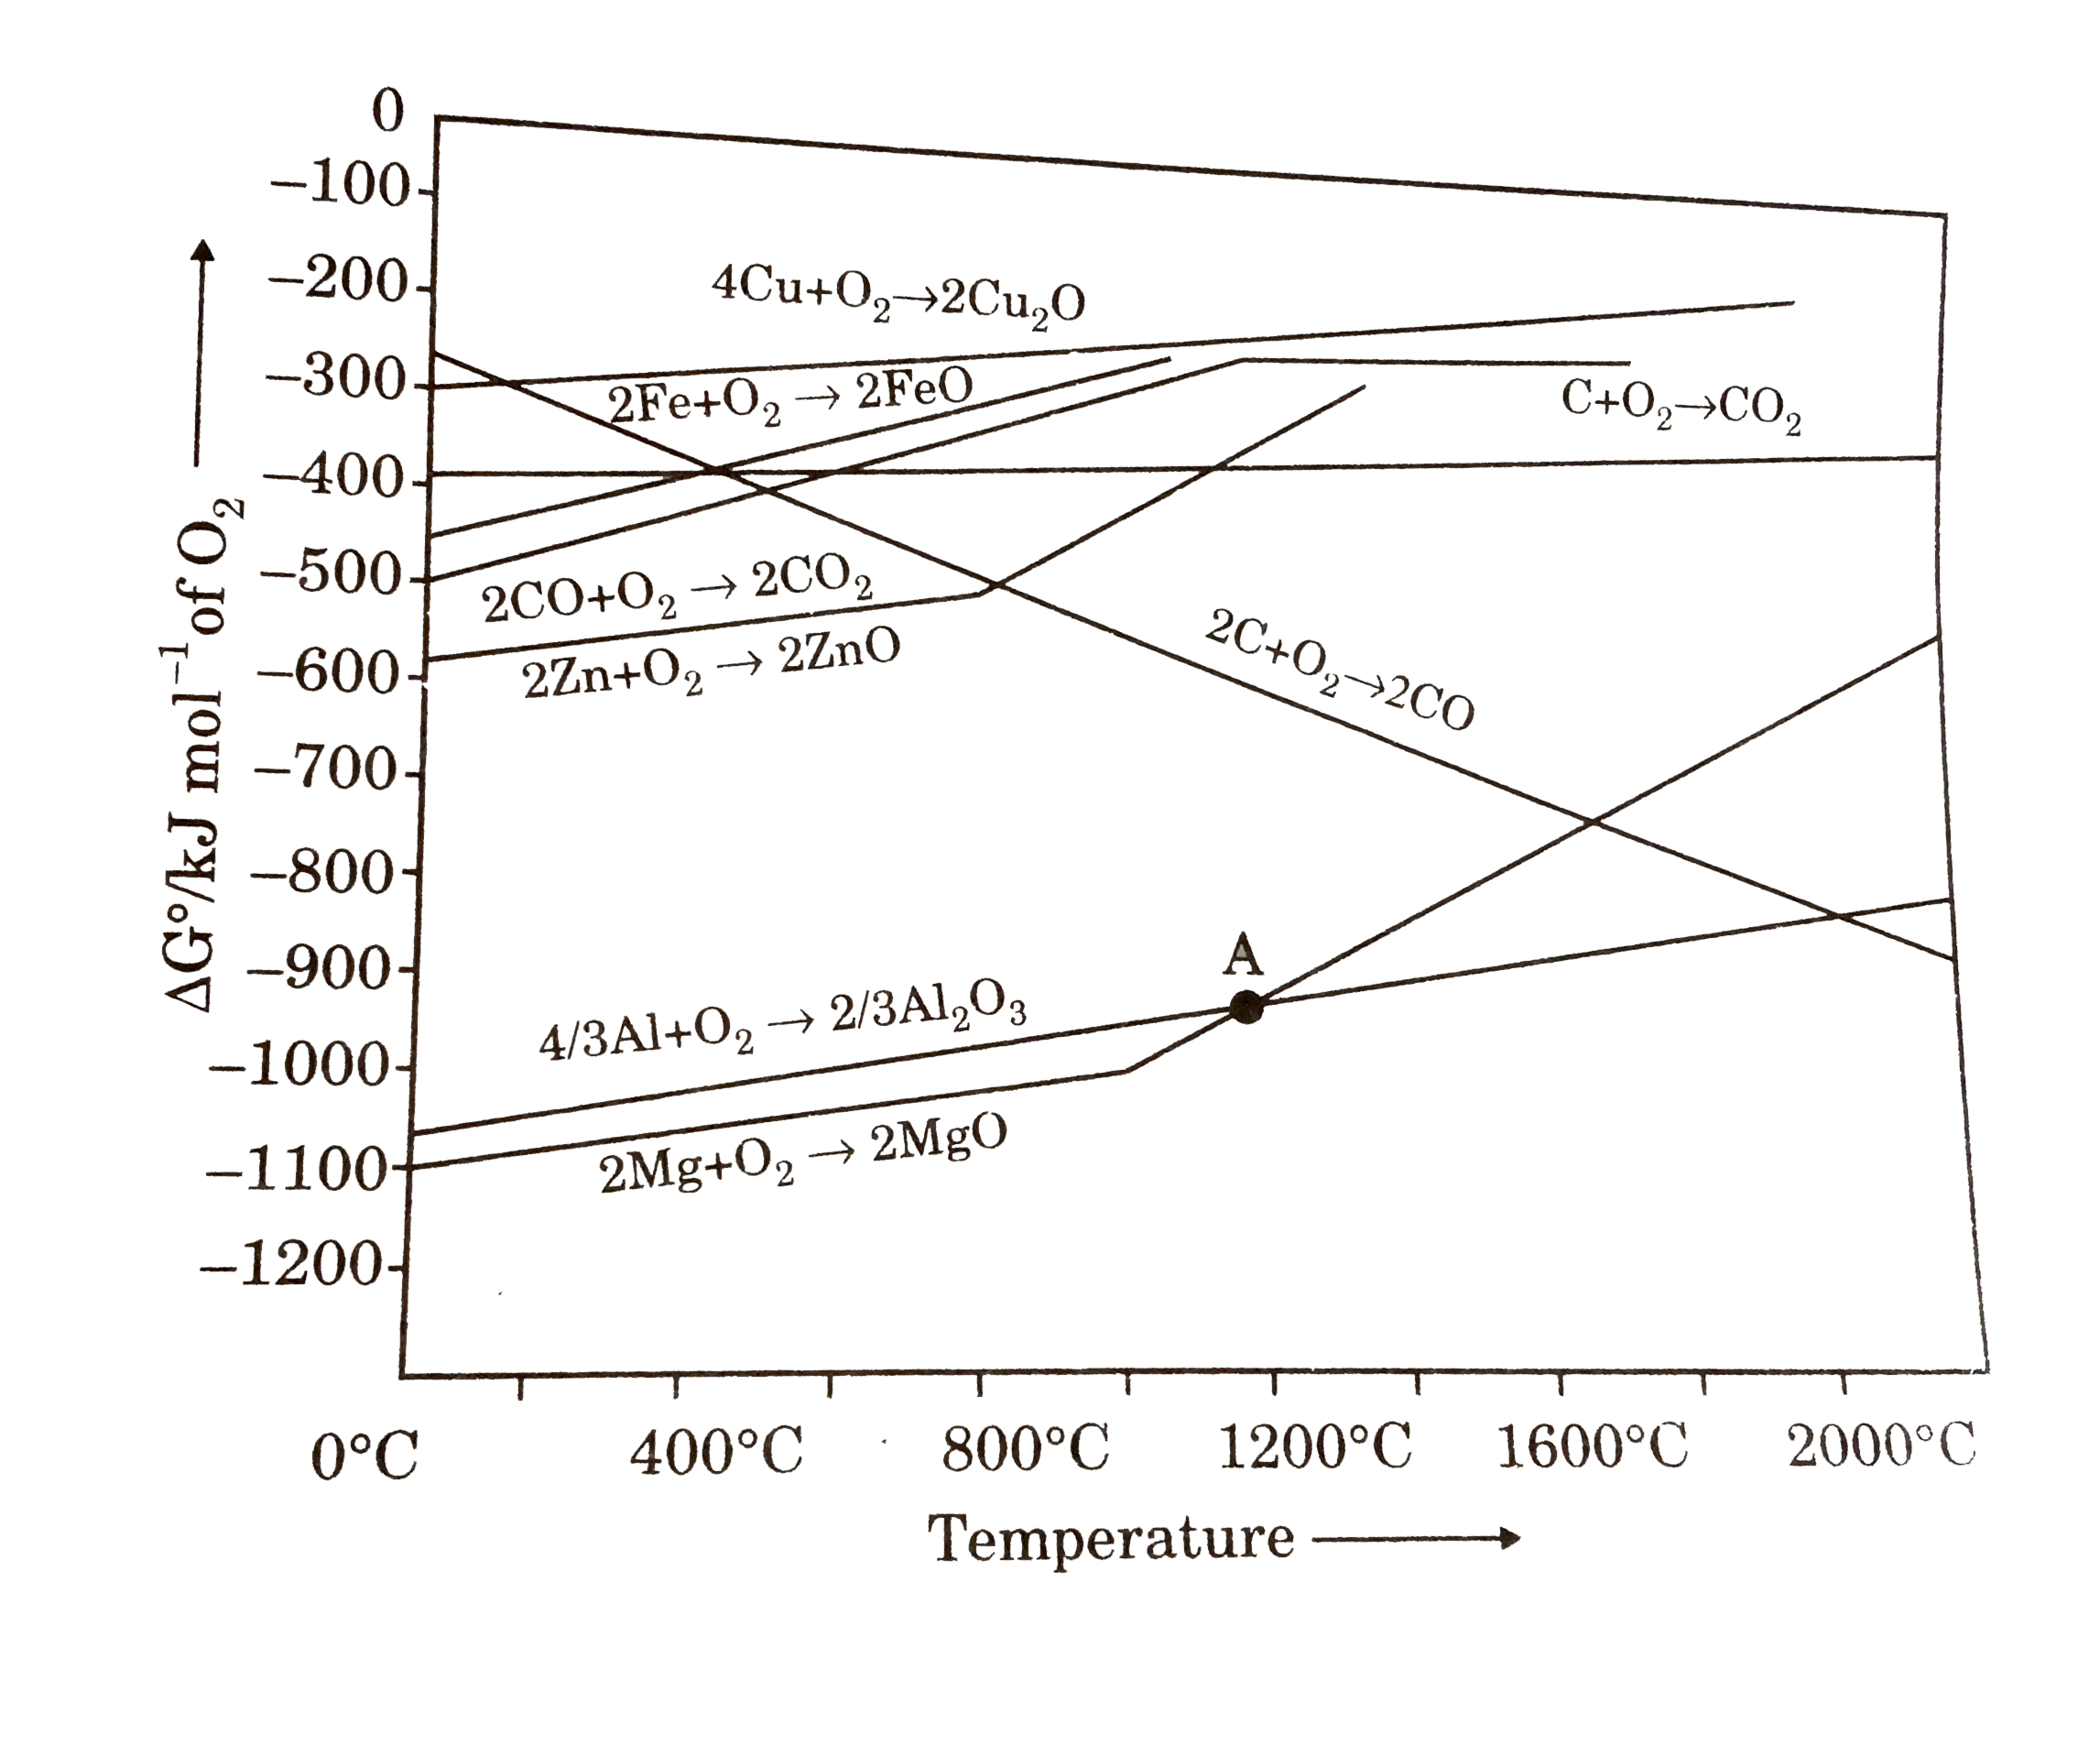
Which of the following statement is true?View SolutionThe line graph shows the production of steel of a certain country. Study the diagram and answer the following questions.
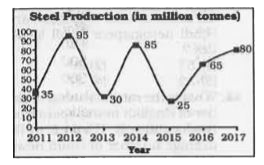
In which year was the steel production lesser than that of the previous year?View Solution

