Draw the graph of f(x)=∣∣∣x2−2x2−1∣∣∣ .Solution in Bengali
Video Solution
Text Solution
Let us first draw the graph of the function g(x)=x2−2x2−1.
The domain of the function is R−{−1,1}.
1. y-intercept
f(0)=2
So the graph cuts the y-axis at (0,2).
2. x-intercept (zeros)
Put y=0 or x2−2=0∴x=±√2
Hence the graph intersects the x-axis at (±√2,0).
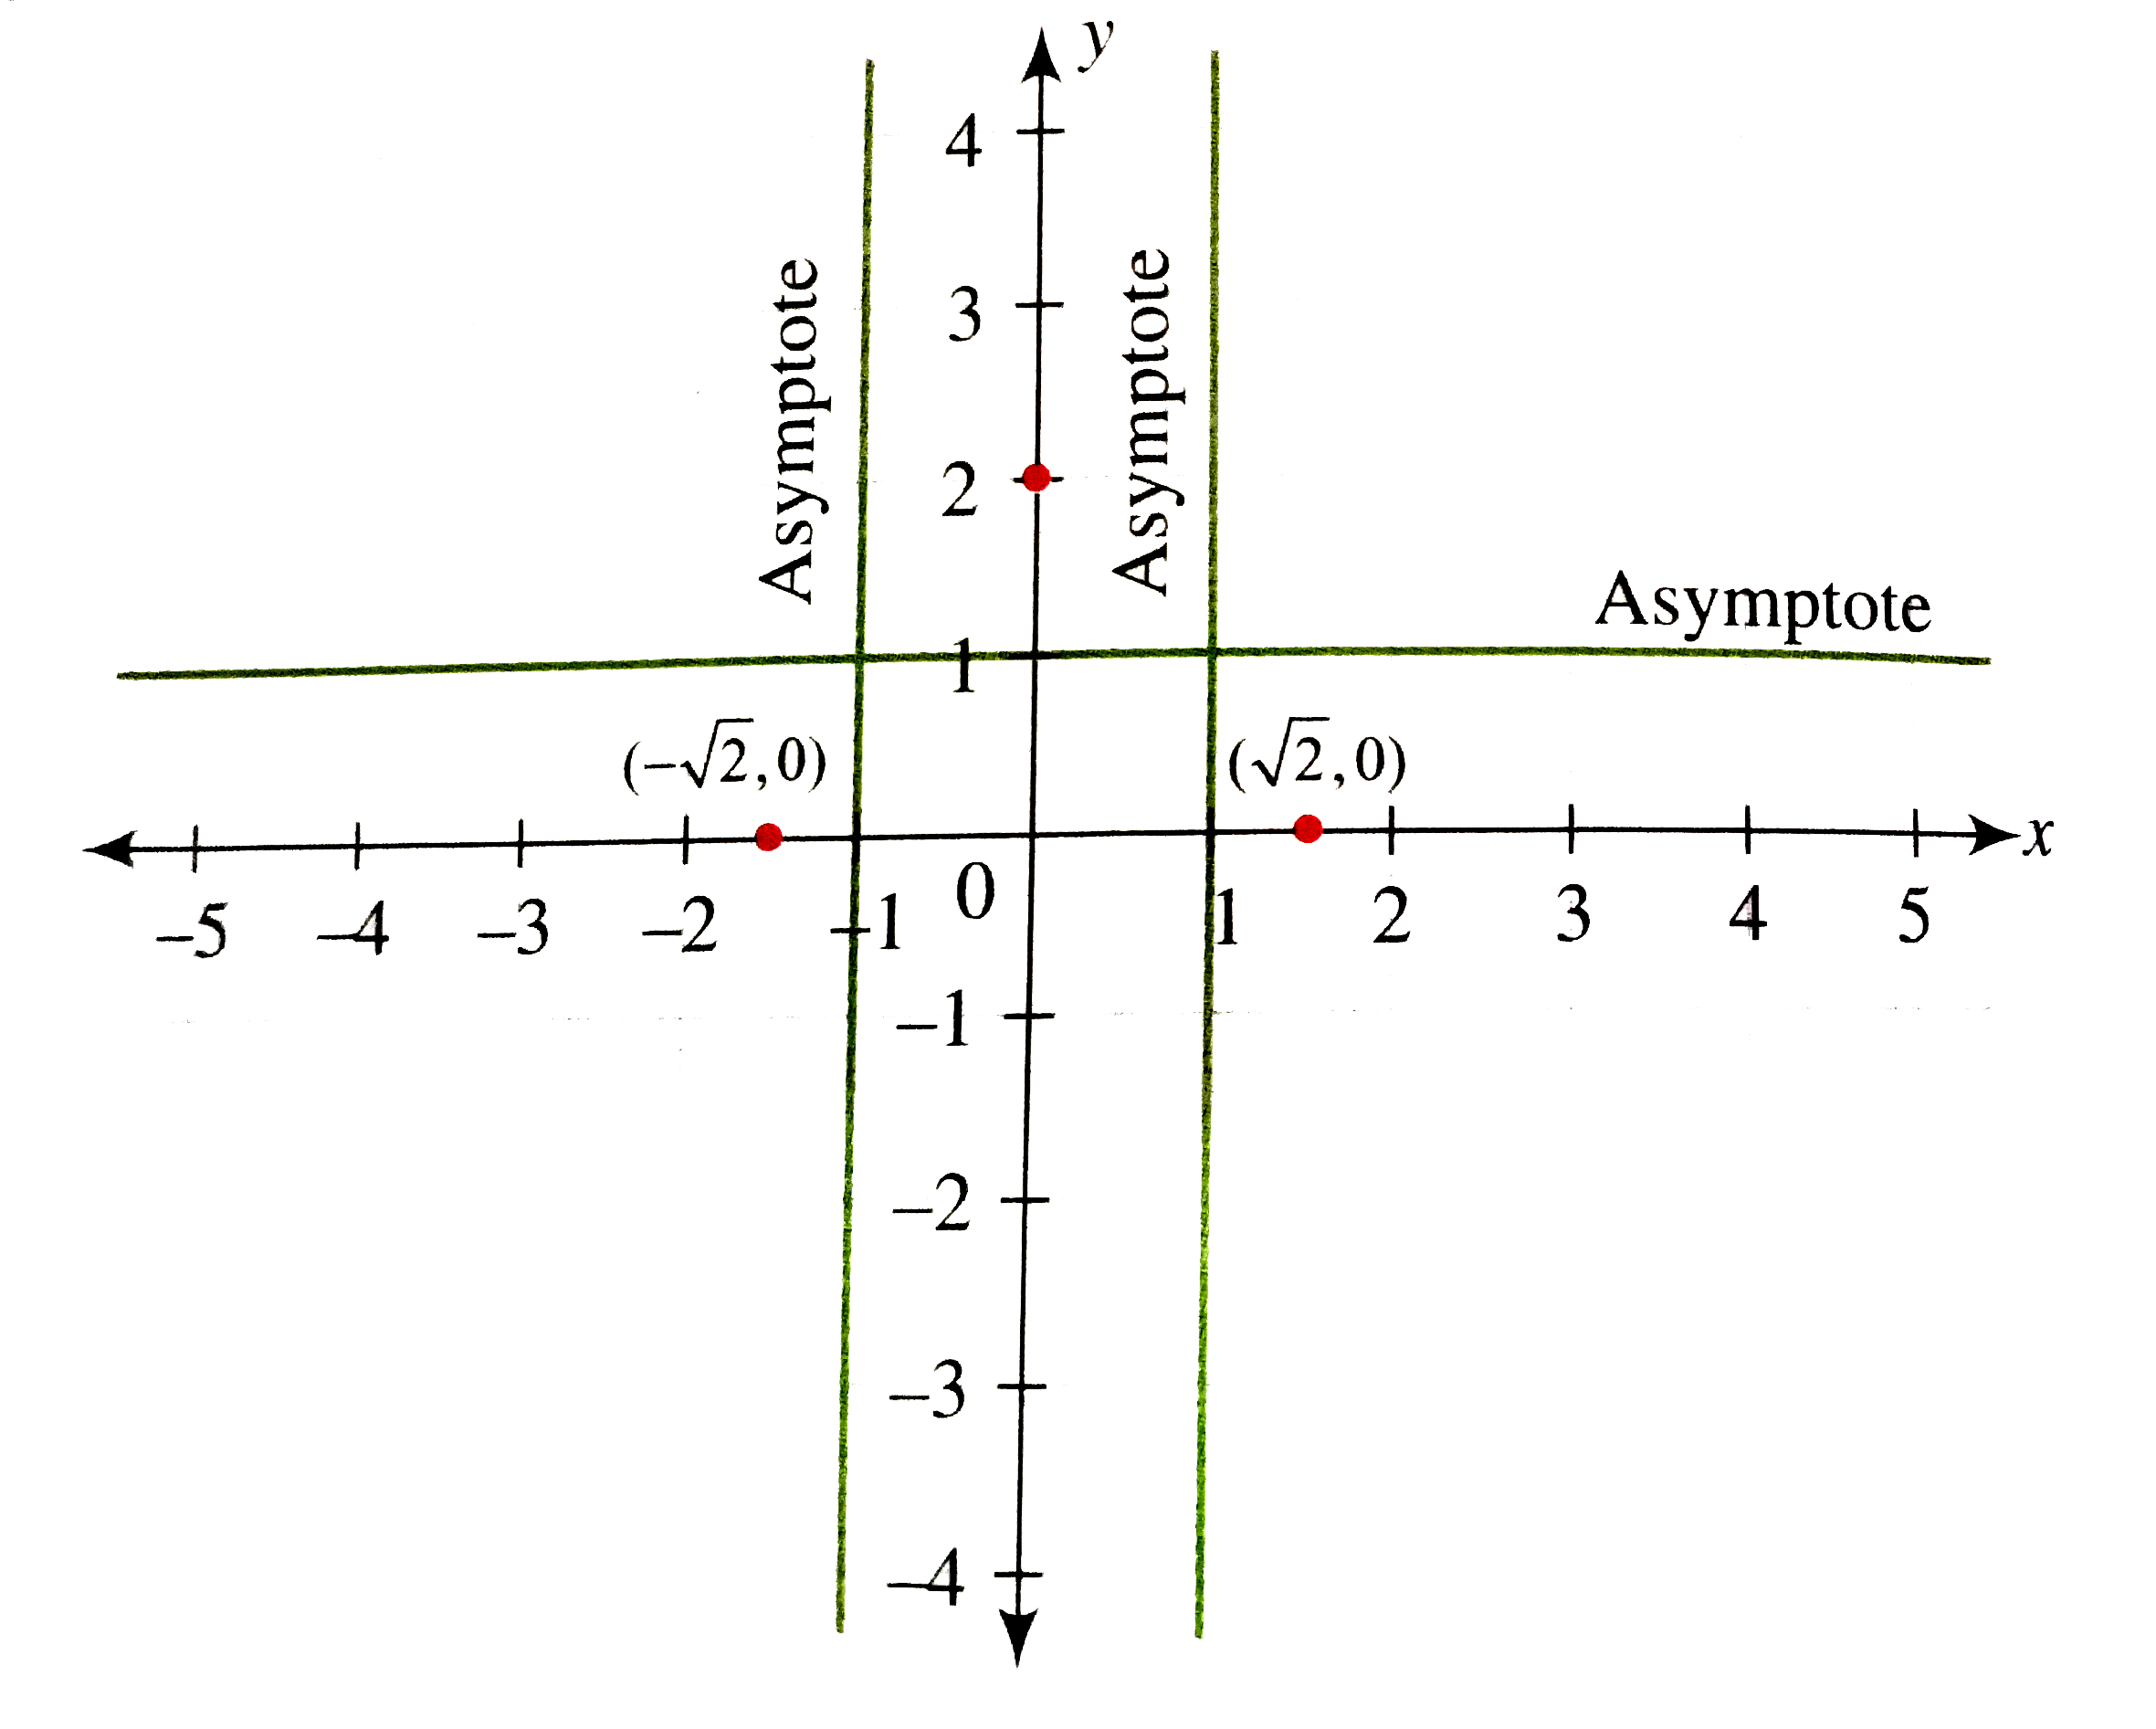
3. Asymptotes
Vertical asymptotoes
Graph has the vertical asymptote as x2−1=0 or x=±1.
Horizontal asymptotes
Since the degree of the numerator and that of the denominator are same, the horizontal asymptote is y=ratios of leading coefficients or y=1.
Clearly, the graph has no oblique asymptote.
4. Extremum
f'(x)=(2x)(x2−1)−(x2−2)2x(x2−1)2=2x(x2−1)2
f'(x)>0 for x>0,x≠1 where the function increases.
f'(x)<0 for x<0,x≠−1 where the function decreases.
f'(x)=0⇒x=0, where is the point of minima.
Thus, important points and lines are as follows.

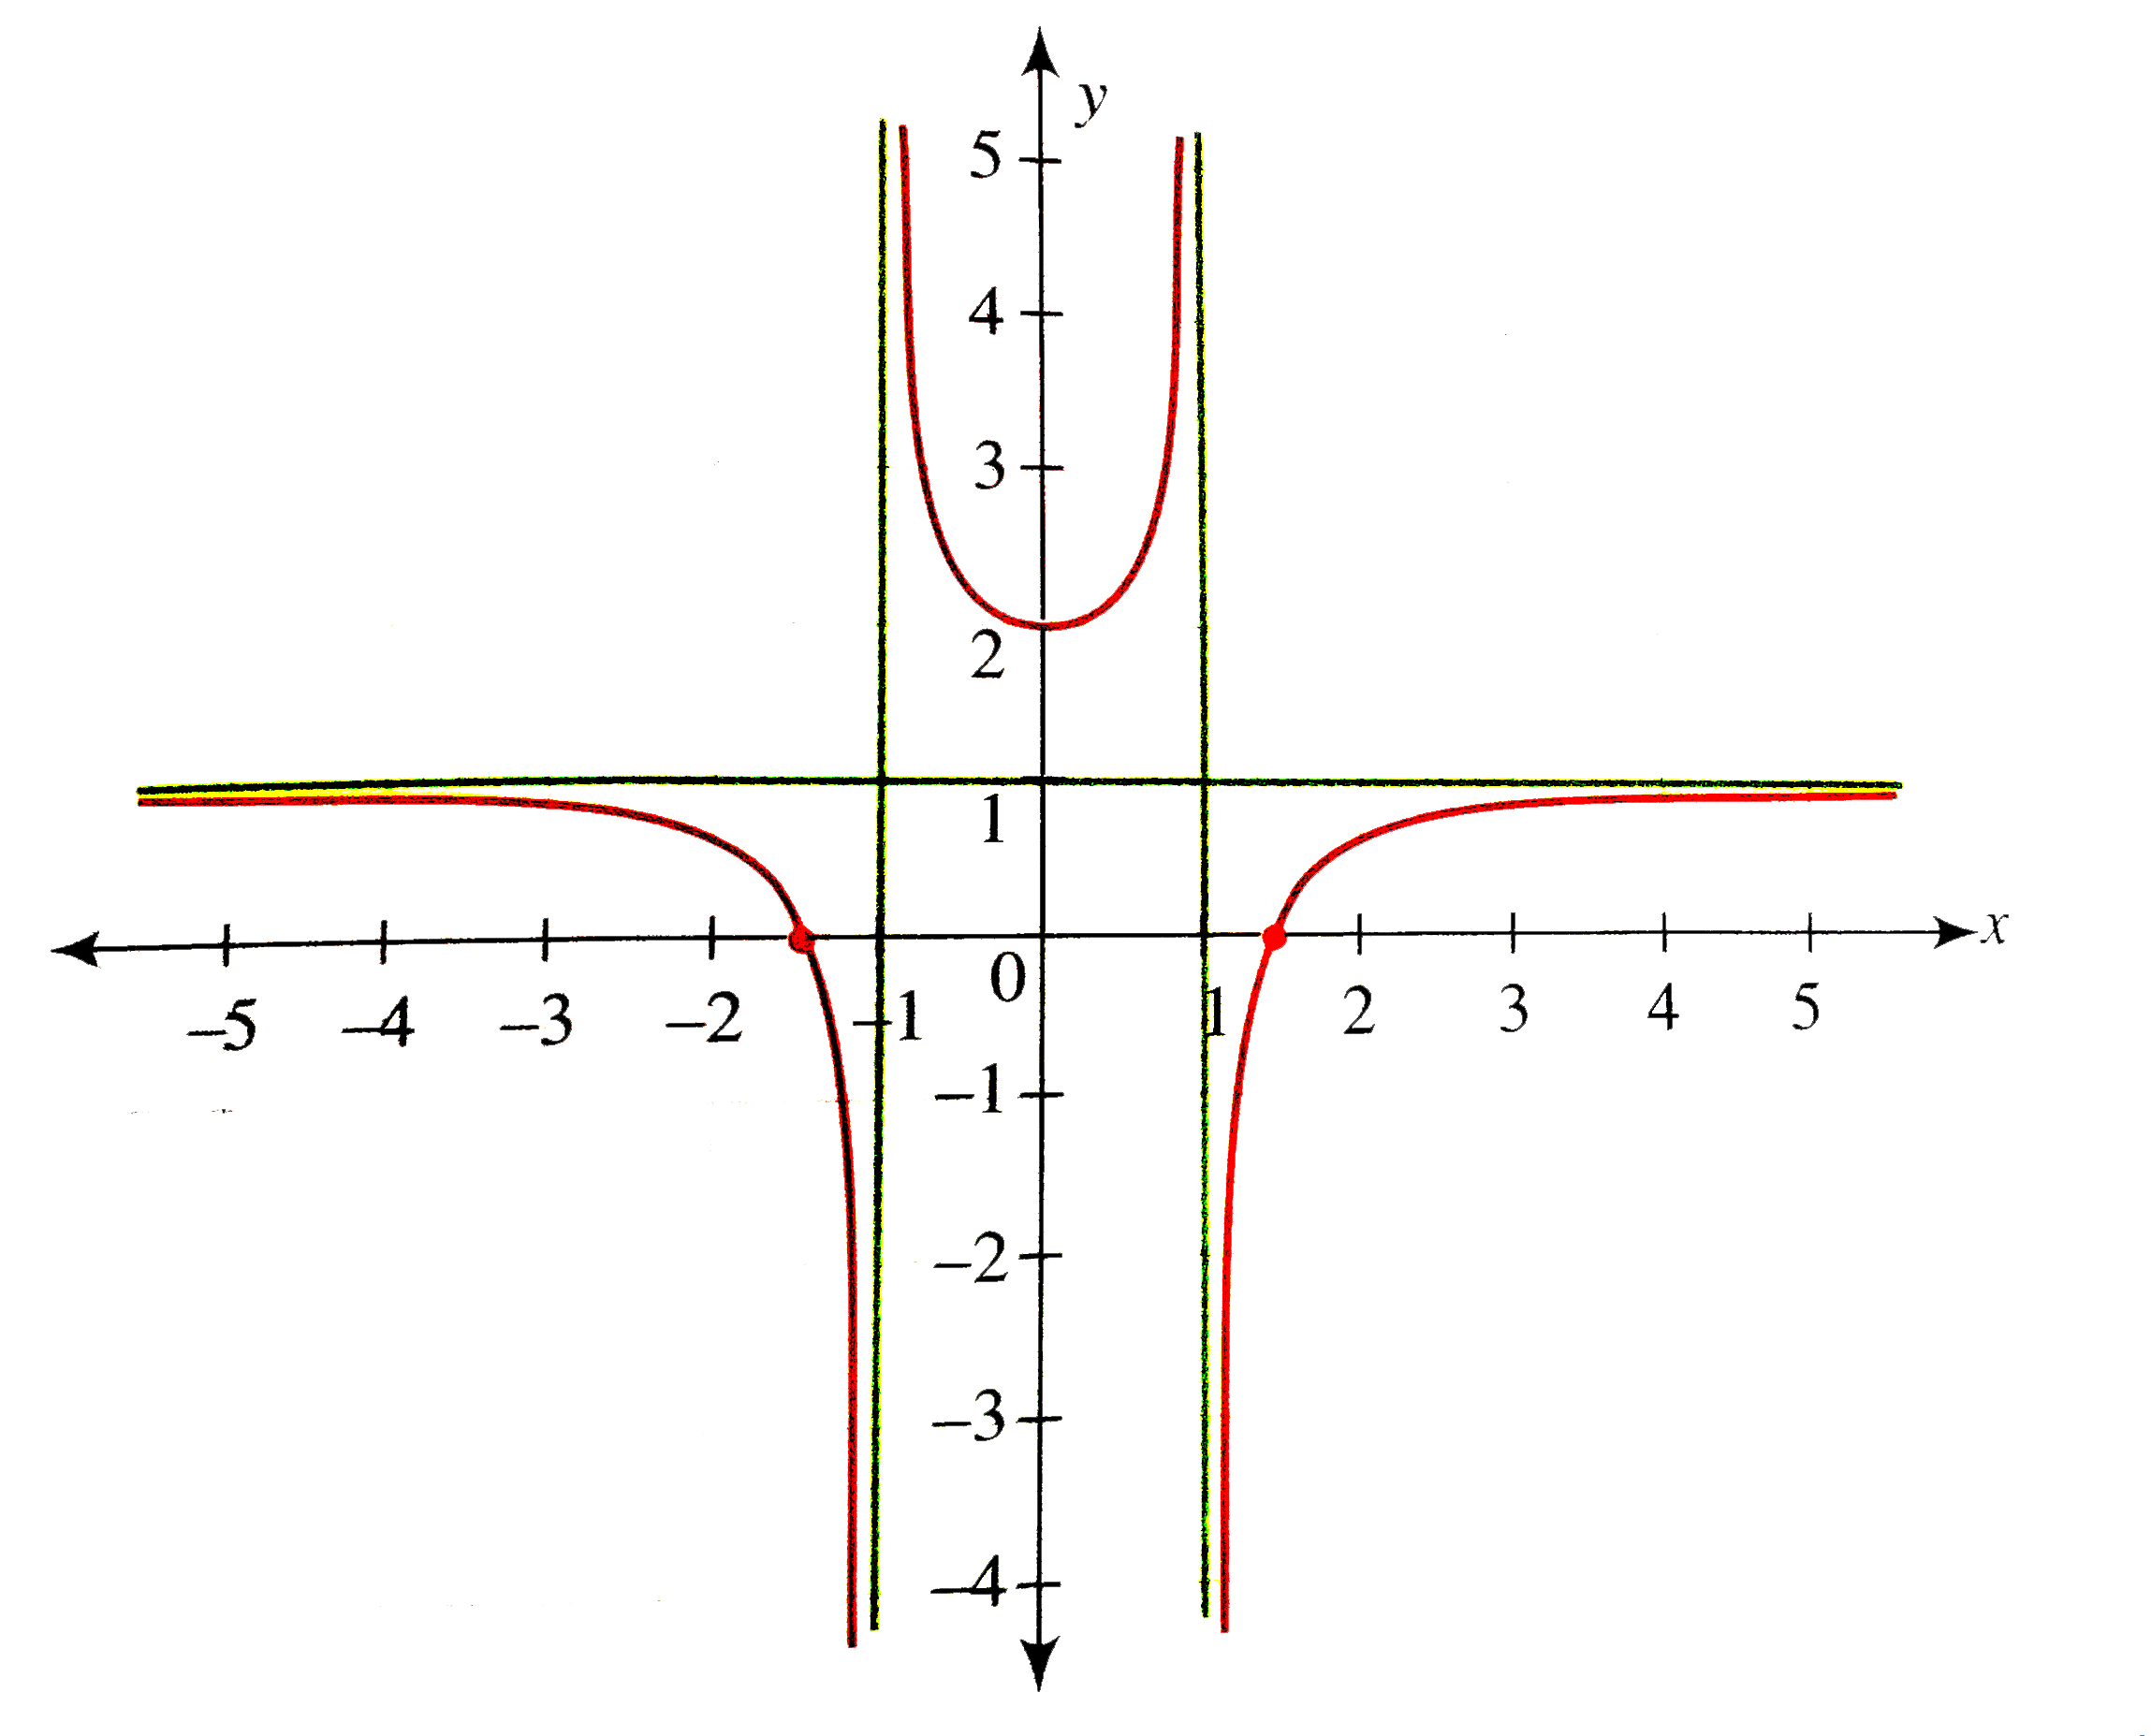
limx→−∞x2−2x2−1=1 and limx→−1−1x2−2x2−1=−∞
So f(x) decreases from 1 to −∞ when x increases from −∞ to -1 crossing the x-axis at (−√2,0).
limx→−1+x2−2x2−1=∞ and f(0)=2
So f(x) decreases from ∞ to 2 when x increases from -1 to 0.
limx→1−x2−2x2−1=∞
So f(x) increases from 2 to ∞ when x increases from 0 to 1.
limx→1+x2−1x2−1=−∞ and limx→∞x2−2x2−1=1
So f(x) increases form −∞ to 1 when x increases from 1 to ∞ crossing the x-axis at (√2,0).
Hence the graph of the function can be drawn as shown in the following figure.

Also the function is even, hence the graph is symmetrical about the y-axis.
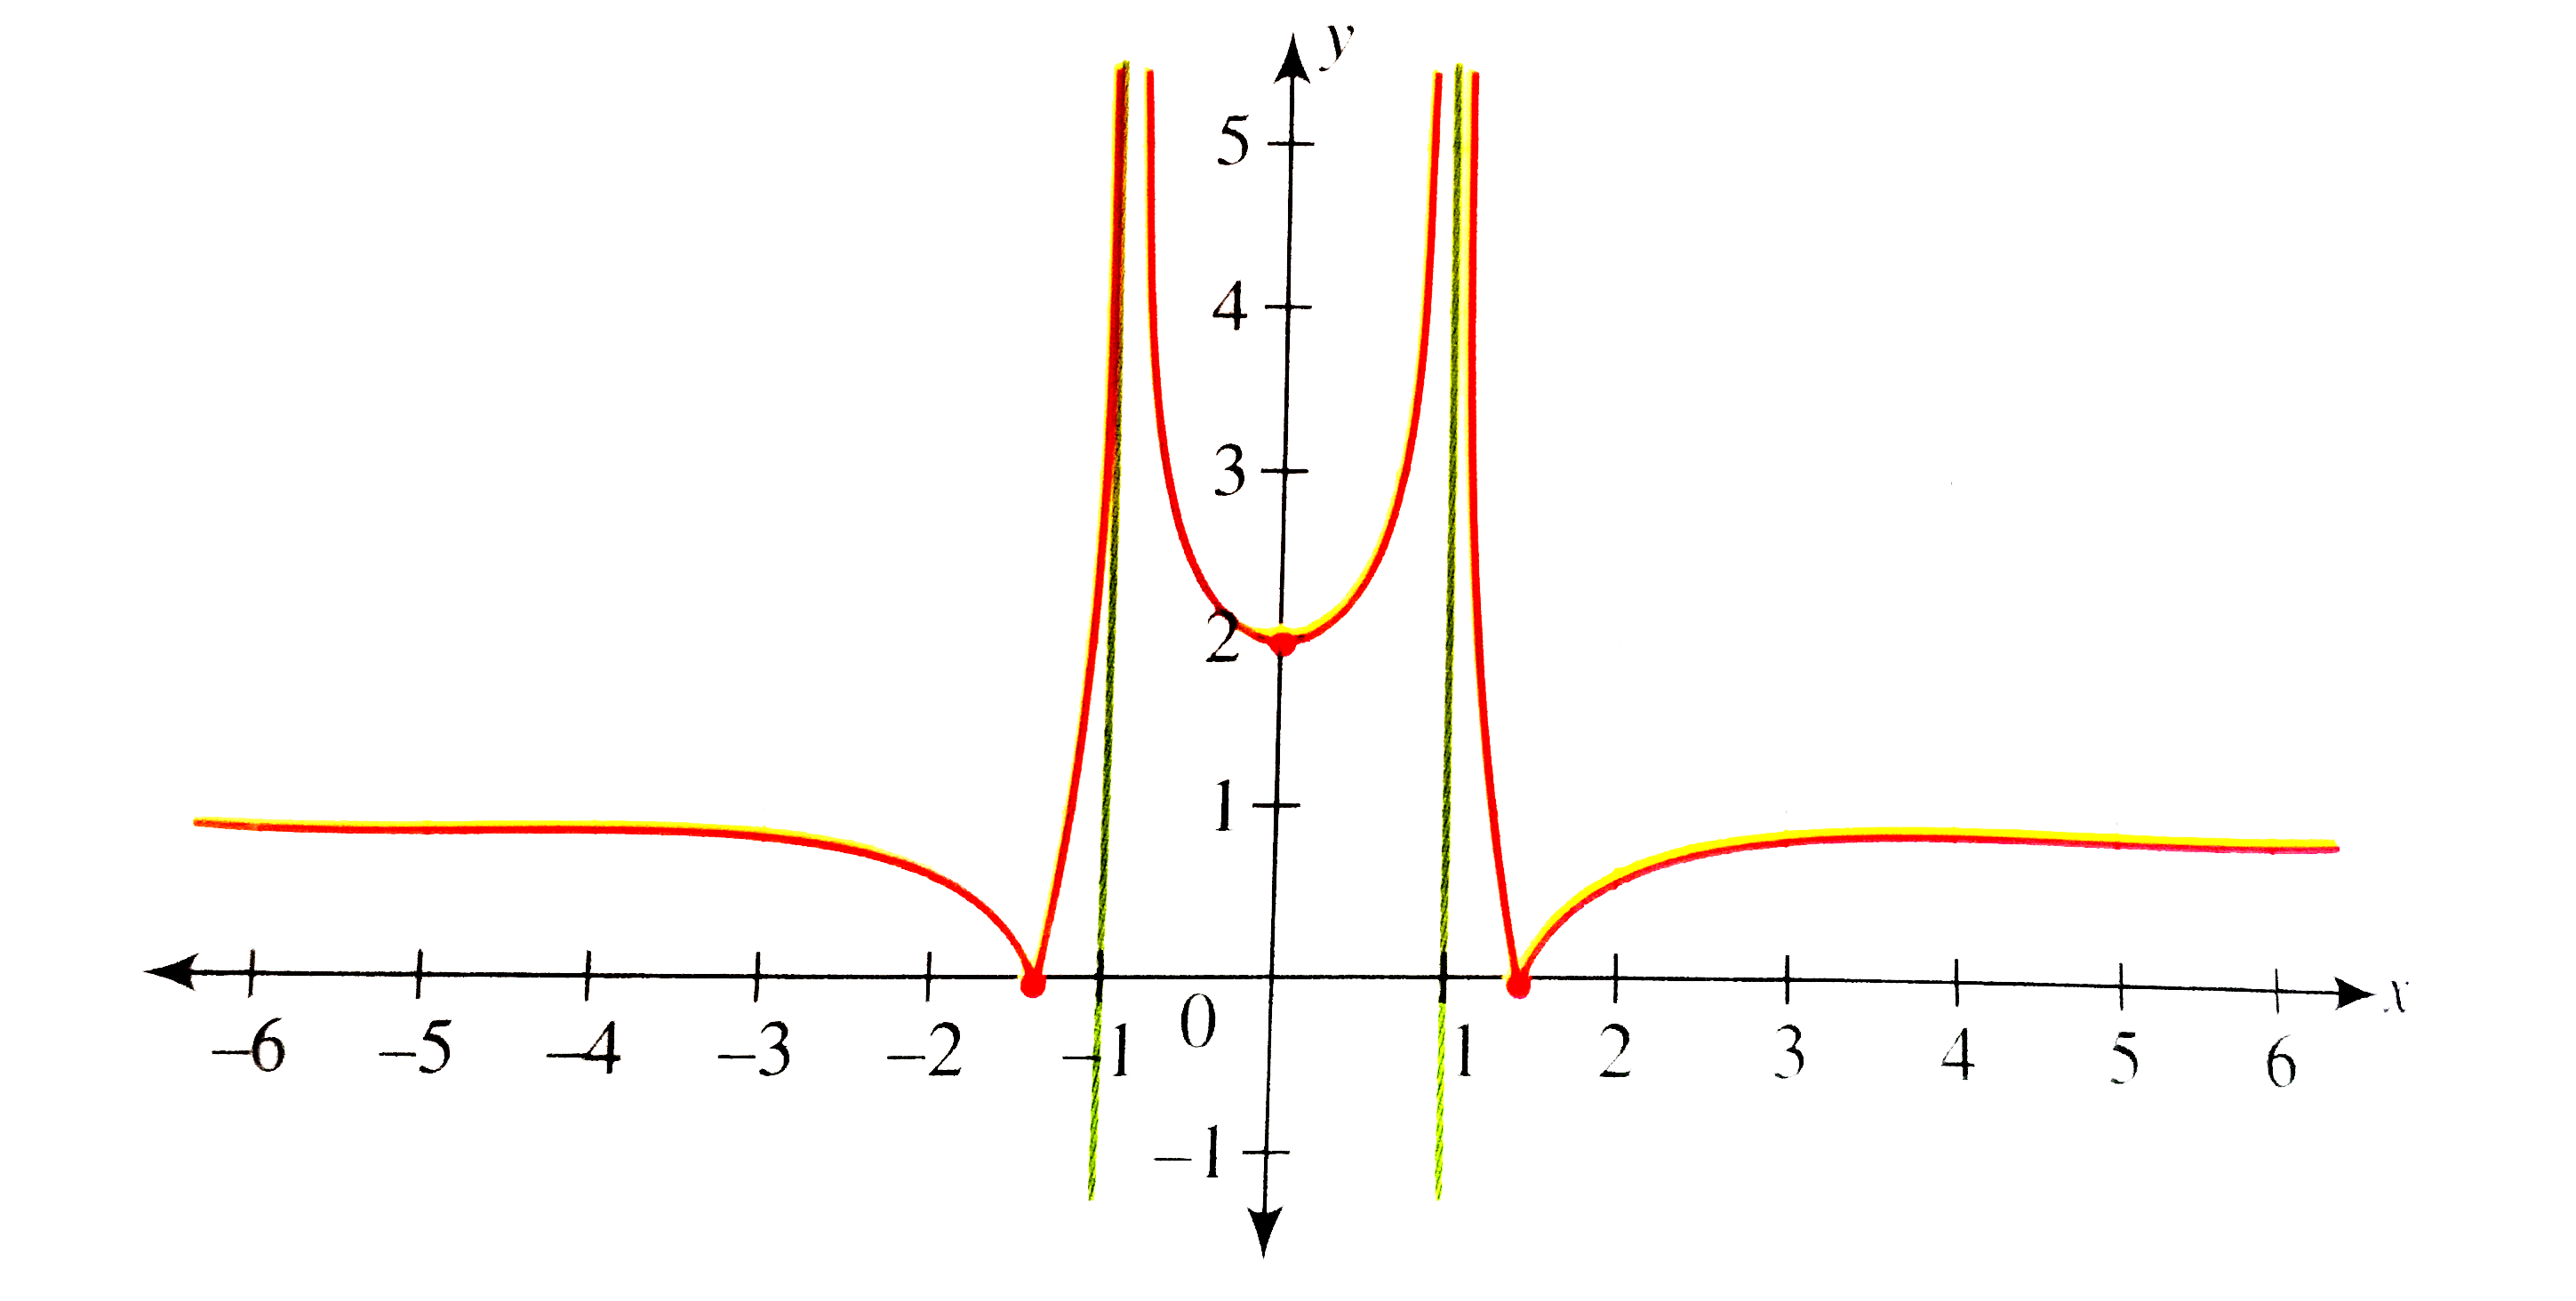
To draw the graph of y=f(x)=∣∣∣x2−2x2−1∣∣∣, flip the portion of the graph of y=x2−2x2−1 which lies below the x-axis over the x-axis.

|
Topper's Solved these Questions
- GRAPHS OF POLYNOMIAL AND RATIONAL FUNCTIONSBOOK - CENGAGE PUBLICATIONCHAPTER - GRAPHS OF POLYNOMIAL AND RATIONAL FUNCTIONSEXERCISE - Exercises
17 Videos
- GRAPHICAL TRANSFORMATIONSBOOK - CENGAGE PUBLICATIONCHAPTER - GRAPHICAL TRANSFORMATIONSEXERCISE - ILLUSTRATION
78 Videos
- GRAPHS OF ELEMENTARY FUNCTIONS BOOK - CENGAGE PUBLICATIONCHAPTER - GRAPHS OF ELEMENTARY FUNCTIONS EXERCISE - EXERCISES
34 Videos
Similar Questions
Draw the graph of y=(x−1)(x2−x+1).
View SolutionPlot y=|x|,y+x−2∣,andy=|x|2∣
View SolutionDraw the graph of y=1(1/x).
View SolutionDraw the graph of f(x)=∣∣∣x2−2x2−1∣∣∣ .
View SolutionDraw the graph of y=f(x)=x+1x2+1
View SolutionDraw the graph of y=f(x)=x2x2+1.
View SolutionDraw the graph of f(x)=cot−1(2−|x|2+|x|).
View SolutionDraw the graph of f(x)=∣∣∣x2−2x2−1∣∣∣ .
View SolutionDraw the graph of f(x)=(x−1)|(x−2)(x−3)|.
View SolutionDraw the graph of y=f(x)=x+1x2+1
View SolutionDraw the graph of f(x)=∣∣∣x2−2x2−1∣∣∣ .
View SolutionDraw the graph of y=f(x)=x2x2+1.
View SolutionDraw the graph of f(x)=2|x−1|x2+1.
View SolutionDraw the graph of f(x)=cot−1(2−|x|2+|x|).
View SolutionDraw the graph of f(x)=∣∣∣x2−2x2−1∣∣∣ .
View SolutionDraw the graph of y=f(x)=(x+1)/(x^(2)+1)
View Solution
