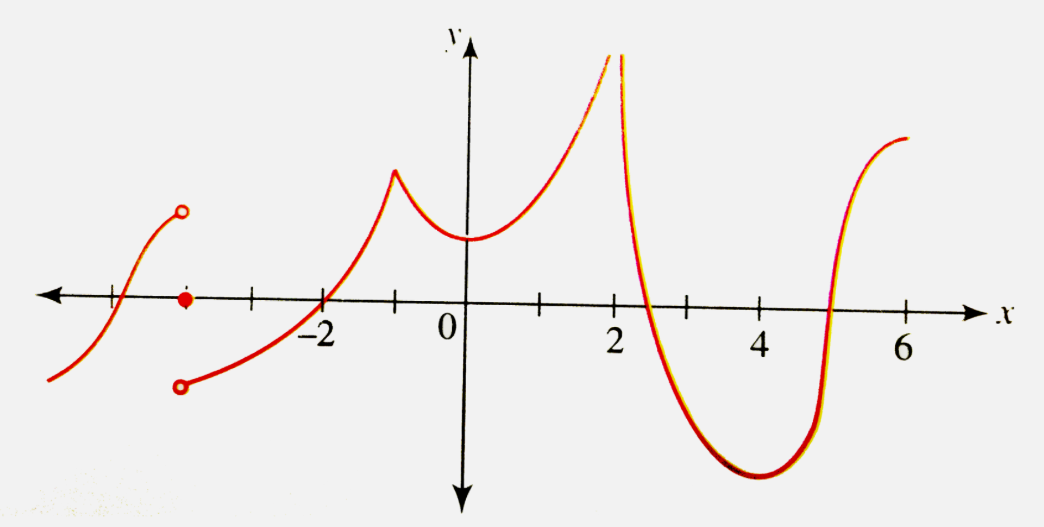
The graph of f is shown. State, with reason, the numbers at which f is not differentiable.
 Solution in Bengali
At x =- 4, f is discontinuous, hence non-differentiable.
At x =- 1, f is continuous but has corner, hence non-differentiable.
At x = 2, f has vertical asymptote, hence non-differentiable.
At x = 5, f has vertical tangent, hence non-differentiable.
Topper's Solved these Questions
- GETTING STARTED WITH GRAPHSBOOK - CENGAGE PUBLICATIONCHAPTER - GETTING STARTED WITH GRAPHSEXERCISE - Exercises 1.9
1 Videos
- GETTING STARTED WITH GRAPHSBOOK - CENGAGE PUBLICATIONCHAPTER - GETTING STARTED WITH GRAPHSEXERCISE - Exercises 1.10
1 Videos
- GETTING STARTED WITH GRAPHSBOOK - CENGAGE PUBLICATIONCHAPTER - GETTING STARTED WITH GRAPHSEXERCISE - Exercises 1.7
1 Videos
- FUNCTIONSBOOK - CENGAGE PUBLICATIONCHAPTER - FUNCTIONSEXERCISE - Comprehension Type
7 Videos
- GRAPH OF INVERSE TRIGONOMETRIC FUNCTIONSBOOK - CENGAGE PUBLICATIONCHAPTER - GRAPH OF INVERSE TRIGONOMETRIC FUNCTIONSEXERCISE - Exercises
18 Videos
Similar Questions
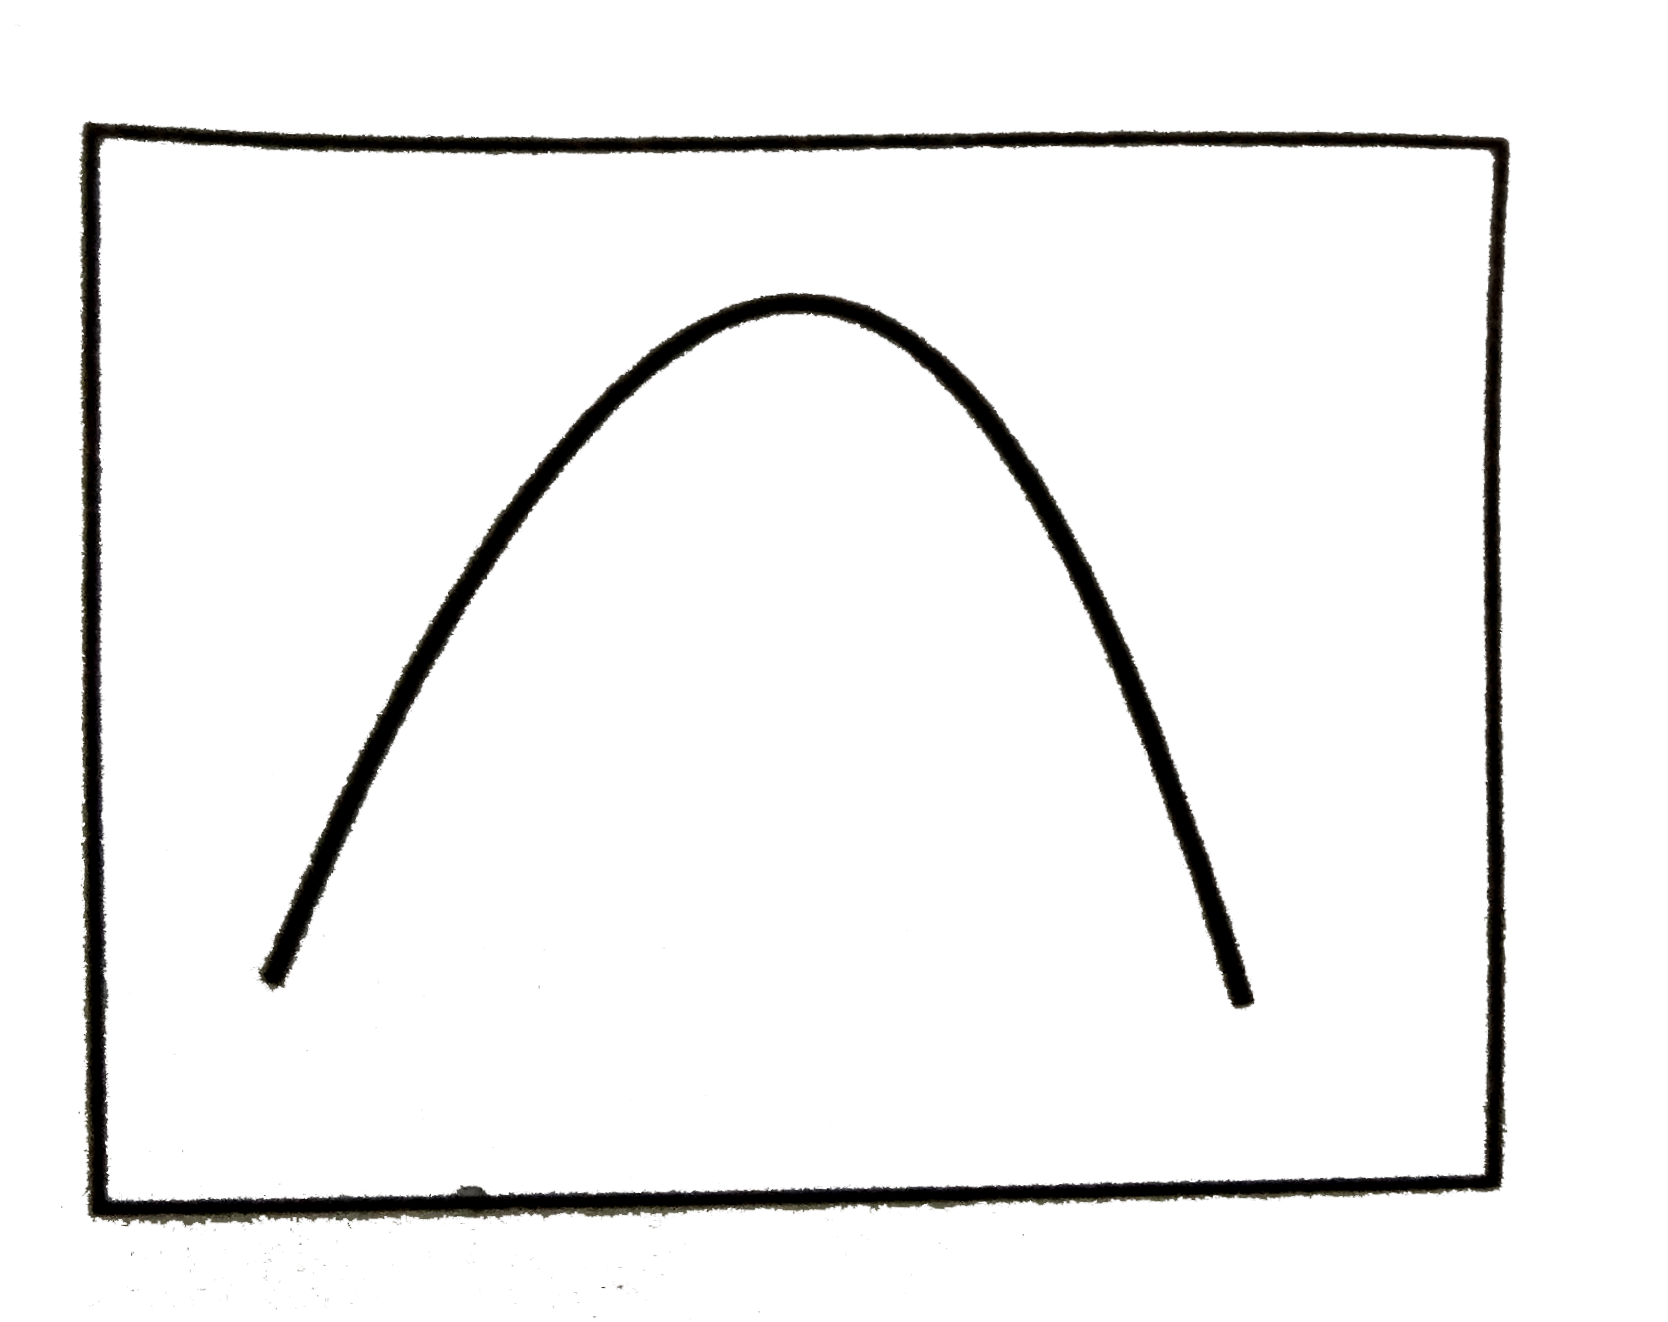
Select the right option regarding the given graph.

View Solution(a) Can the graph of the function intersect the horizontal asymptote?
(b) Can the graph of the function intersect the vertical asymptote?
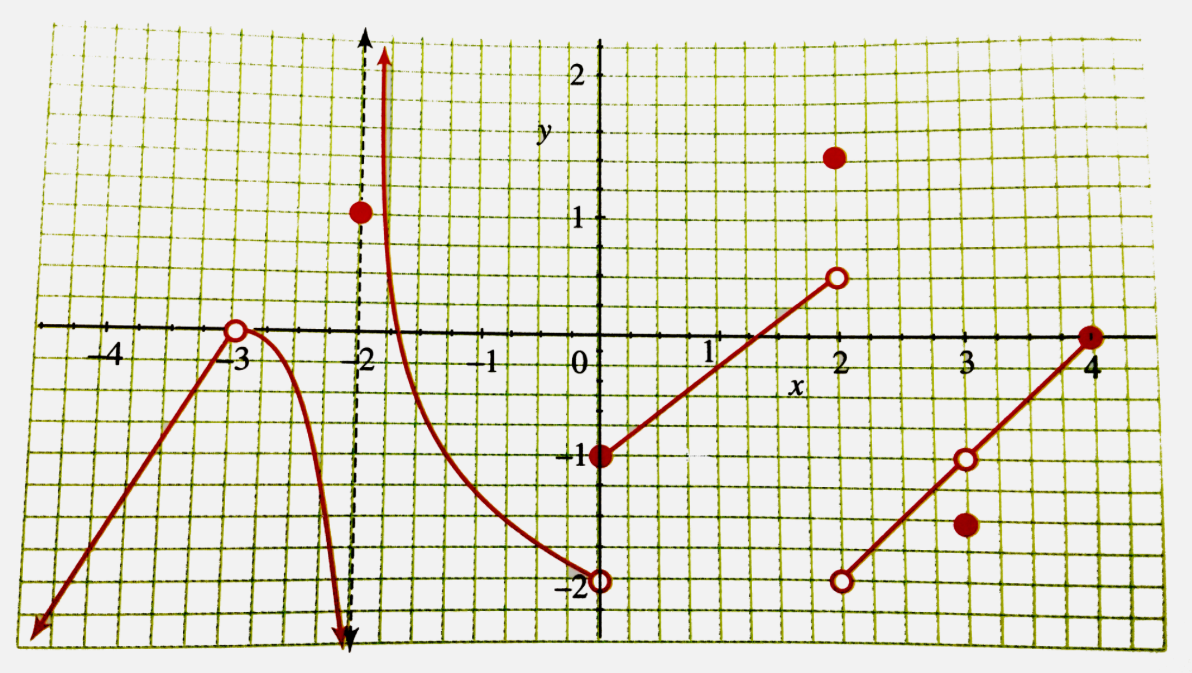
View SolutionThe graph of y = f(x) is as shown in the following figure.

Find the following values
(i)f(−3) (ii)f(−2) (iii)f(0)
(iv)f(2) (v)f(3) (vi)limx→−3f(x)
(vii)limx→0f(x) (viii)limx→2f(x) (ix)limx→3f(x)
(x)limx→2−f(x) (xi)limx→−2+f(x) (xii)limx→0−f(x)
(x iii) limx→0+f(x)
View SolutionLet f(x)=x2−2x−1∀x∈R.Letf:(−∞,a]→[b,∞), where a is the largest real number for which f(x) is bijective.
If f:R→R, then range of values of k for which equation f(|x|)=k has 4 distinct real roots is
View SolutionDraw the graph of y=tan−1x−cot−1x.
View SolutionWhich of the following are correct chain isomers of butane ? (i)
View SolutionDetermine the point of symmetry of a regular hexagon.
View SolutionMatch the following Column A to Column B

View SolutionMatch the following Column A to Column B

View SolutionMatch the following Column A to Column B

View SolutionThe inequation represented by the graph given below is :
View SolutionThe inequation that best describes the graph given below is _________
View SolutionThe inequation that best describes the following graph is _________
View SolutionWhich inequations represent the shaded region in the given figure
View SolutionThe equation of straight line shown in figure is :
ltimg src="https://d10lpgp6xz60nq.cloudfront.net/physics_images/ALN_PHY_R04_E01_020_Q01.png" width="80%"gt
View SolutionWhat is the distance OA for the square shown in figure :- ltimg src="https://d10lpgp6xz60nq.cloudfront.net/physics_images/ALN_PHY_R05_E01_015_Q01.png" width="80%"gt
View Solution
