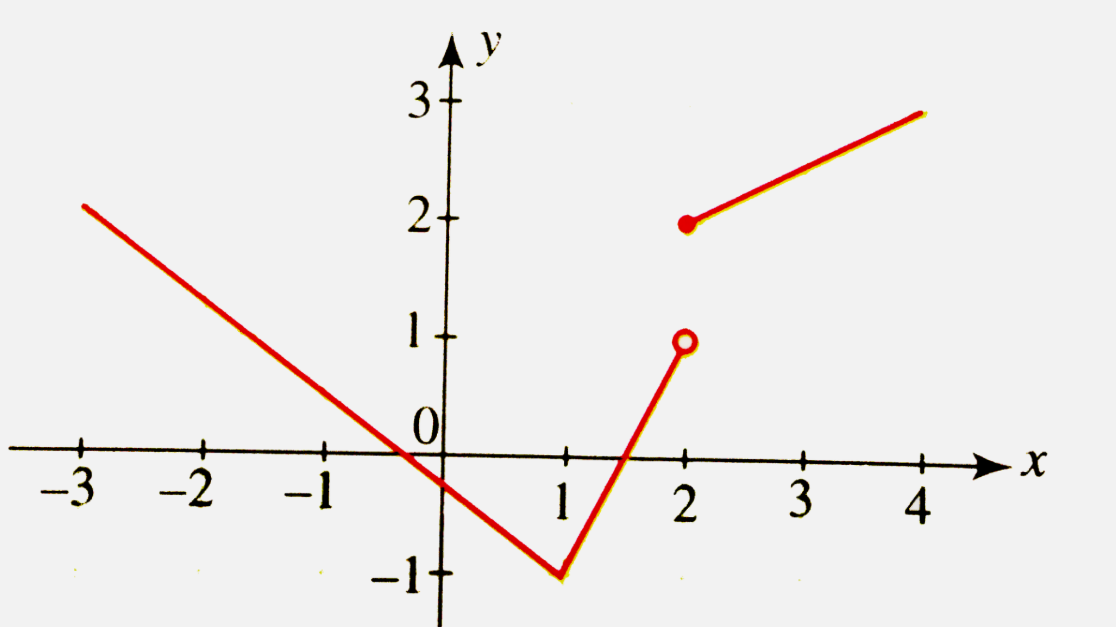
Does the following graph represent a function or a relation?
 Solution in Bengali
Vertical line x = 2 meets the above graph at (2, 1) and (2, 2). Hence the graph does not represent a function.
Topper's Solved these Questions
- GETTING STARTED WITH GRAPHSBOOK - CENGAGE PUBLICATIONCHAPTER - GETTING STARTED WITH GRAPHSEXERCISE - ILLUSTRATION 1.3
1 Videos
- GETTING STARTED WITH GRAPHSBOOK - CENGAGE PUBLICATIONCHAPTER - GETTING STARTED WITH GRAPHSEXERCISE - ILLUSTRATION 1.4
1 Videos
- GETTING STARTED WITH GRAPHSBOOK - CENGAGE PUBLICATIONCHAPTER - GETTING STARTED WITH GRAPHSEXERCISE - Exercises 1.18
1 Videos
- FUNCTIONSBOOK - CENGAGE PUBLICATIONCHAPTER - FUNCTIONSEXERCISE - Comprehension Type
7 Videos
- GRAPH OF INVERSE TRIGONOMETRIC FUNCTIONSBOOK - CENGAGE PUBLICATIONCHAPTER - GRAPH OF INVERSE TRIGONOMETRIC FUNCTIONSEXERCISE - Exercises
18 Videos
Similar Questions
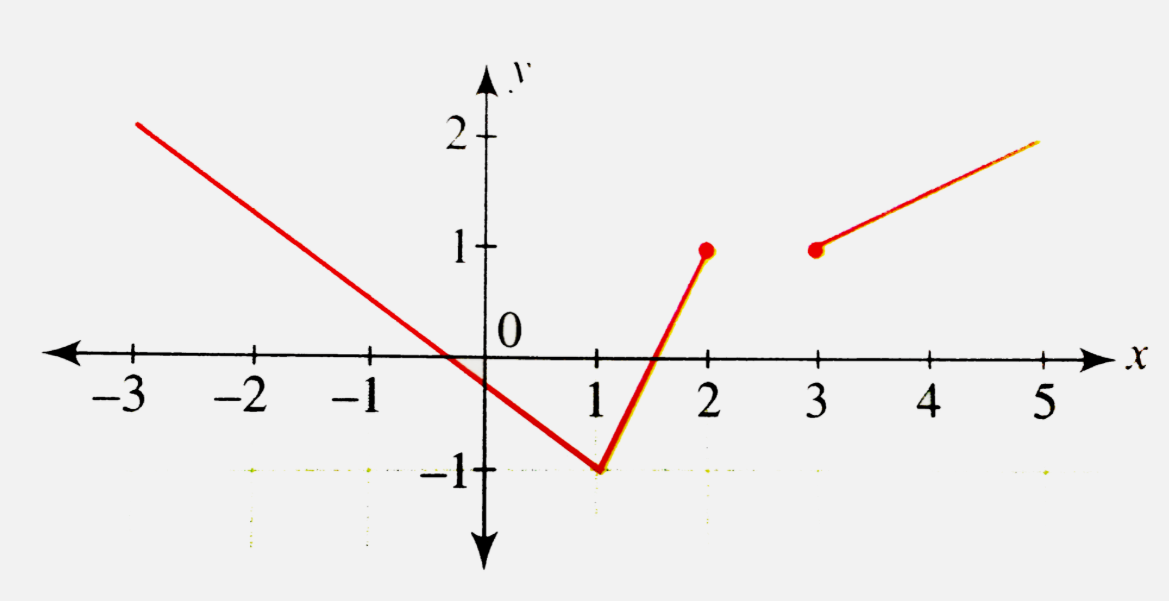
Does the following graph pass the vertical or horizontal line test?

View SolutionIn how many points graph of y=x3−3x2+5x−3 intersect the x-axis?
View SolutionFollowing is the graph of y = f'(x) and f(0) = 0 .

(a) What type of function y = f'(x) is ? Odd or even?
(b) What type of function y = f(x) is ? Odd or even?
(c) What is the value of ∫a−af(x)dx?
(d) Has y = f(x) point of inflection?
(e) What is the nature of y = f(x)? Monotonic or non-monotonic?
View SolutionLet f(x)=x2−2x−1∀x∈R.Letf:(−∞,a]→[b,∞), where a is the largest real number for which f(x) is bijective.
If f:R→R, then range of values of k for which equation f(|x|)=k has 4 distinct real roots is
View SolutionDraw the graph of y=tan−1x−cot−1x.
View SolutionMatch the following lists:

View SolutionHow many lines of symmetry does the above figure have ?
View SolutionWhich of the following are correct chain isomers of butane ? (i)
View SolutionDetermine the point of symmetry of a regular hexagon.
View SolutionDtermine the images of the following figure about the given line :
View SolutionMatch the following Column A to Column B

View SolutionMatch the following Column A to Column B

View SolutionMatch the following Column A to Column B

View SolutionThe inequation represented by the graph given below is :
View SolutionThe inequation that best describes the graph given below is _________
View SolutionThe inequation that best describes the following graph is _________
View Solution
